Time Zone: GMT +3
Time Frame: Daily (D1) / Weekly Outlook
Weekly Fundamental Overview:
The NZD/CAD currency pair faces key macroeconomic drivers this week centered around incoming economic data from Canada. Market participants are monitoring shifts in Canadian business activity alongside comprehensive employment metrics, which could influence the performance of the Canadian Dollar relative to the New Zealand Dollar.
Price Action:
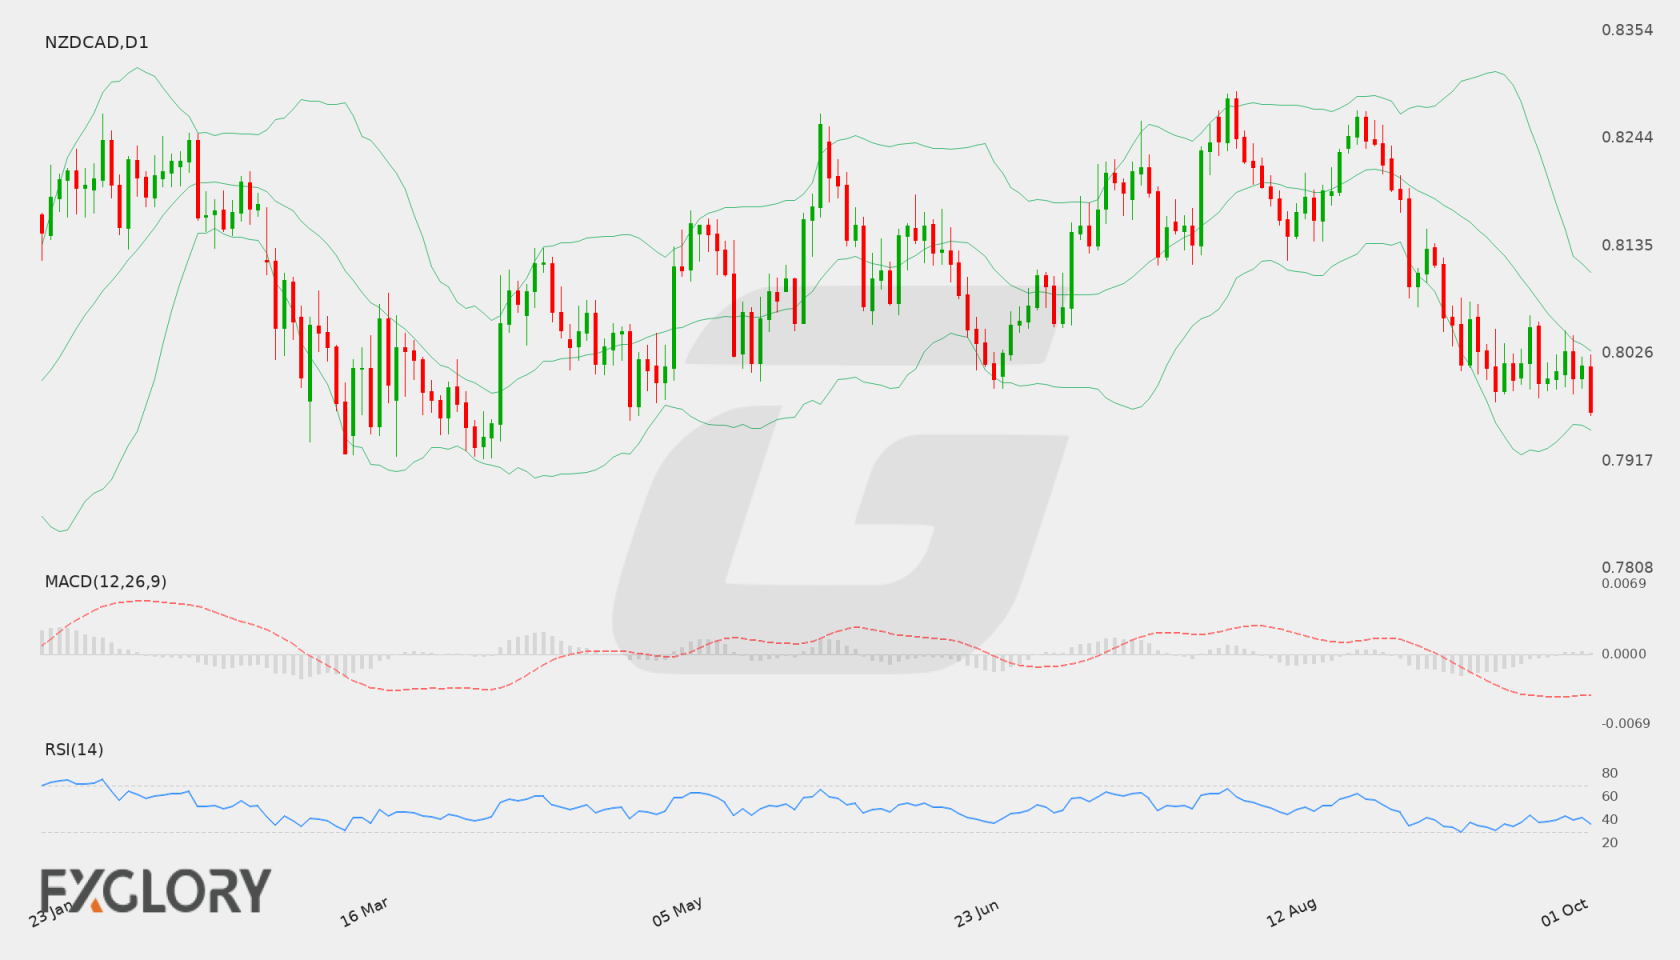
On the Daily (D1) timeframe, NZD/CAD has experienced sustained downward pressure, closing the latest session at 0.79669 after reaching a daily low of 0.79629. The pair continues to trend lower after declining from levels above 0.82000 in recent weeks, showing strong seller presence near the lower boundary of its recent range.
Key Technical Indicators:
Bollinger Bands: The Bollinger Bands on the D1 chart show the middle band at 0.80285, the upper band at 0.81087, and the lower band at 0.79483. Trading at 0.79669, NZD/CAD is positioned well below the 20-period middle band and is gravitating toward the lower band, reflecting strong bearish pressure.
RSI: The 14-day Relative Strength Index (RSI) is currently reading 36.64, which indicates bearish momentum as the oscillator trends toward the oversold threshold without yet signaling an immediate exhaustion.
MACD: The Daily MACD indicator stands at -0.00390, remaining in negative territory and reflecting persistent downward momentum for the NZD/CAD pair.
Support and Resistance:
Key technical levels identified on the Daily chart place immediate support at 0.79629, while substantial resistance is located at 0.82919.
News to Watch for NZDCAD This Week:
- Ivey PMI: Reflects Canadian purchasing managers activity and economic sentiment that can impact Canadian Dollar valuation.
- Unemployment Rate: Provides insight into Canadian labor market conditions that may alter central bank policy expectations.
- Employment Change: Measures net job creation in Canada and can trigger significant volatility across Canadian Dollar currency pairs.
Weekly Outlook and Consideration:
The weekly outlook for NZD/CAD (NZDCAD) points to an ongoing bearish structure on the Daily chart. Price action is pressing against the primary support level at 0.79629, with the last close at 0.79669 remaining beneath the Bollinger middle band of 0.80285. While momentum indicators such as the MACD (-0.00390) and RSI (36.64) show seller dominance, the proximity of the lower Bollinger band at 0.79483 suggests that downside extensions could encounter stabilization if support holds. Major overhead resistance stands at 0.82919, while upcoming Canadian economic data may introduce heightened volatility.
Disclaimer: The analysis provided for NZD/CAD is for informational purposes only and does not constitute investment advice. Traders are encouraged to perform their own analysis and research before making any trading decisions. Market conditions can change quickly, so staying informed with the latest data is essential.