Time Zone: GMT +3
Time Frame: Daily (D1) / Weekly Outlook
Weekly Fundamental Overview:
BCH/USD has experienced a significant shift in market sentiment, backed by elevated trading volumes during recent daily sessions. As a major cryptocurrency, BCHUSD remains sensitive to broad market risk sentiment, macro USD trends, and incoming economic data that shape broader liquidity expectations.
Price Action:
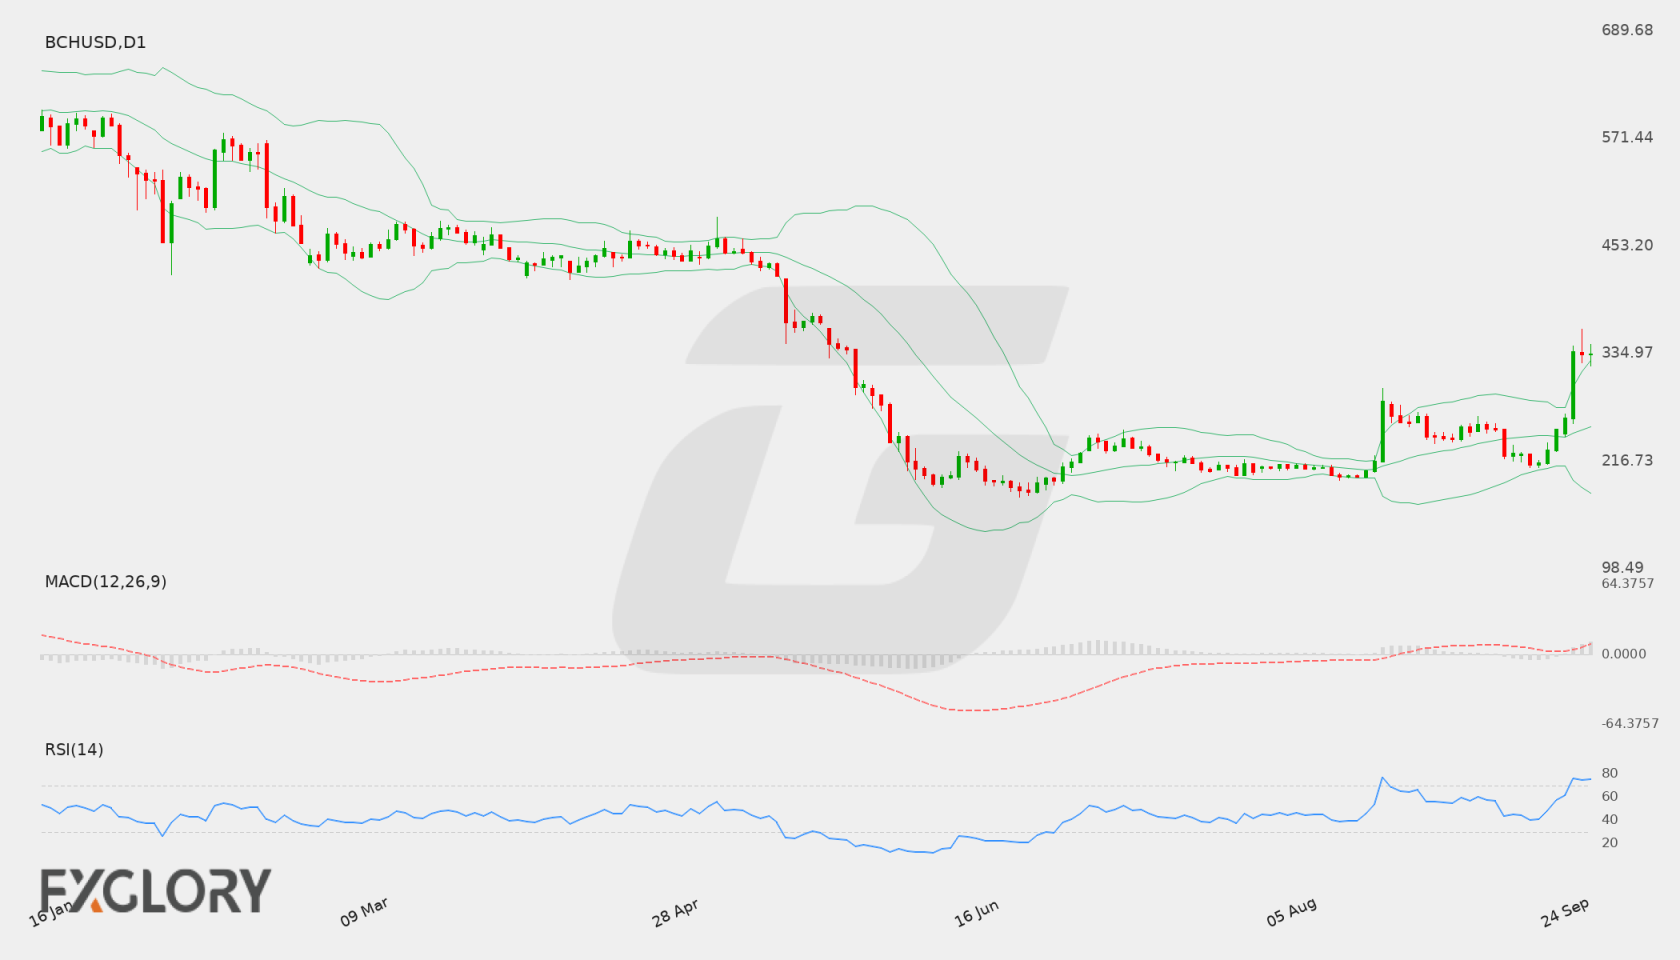
On the daily (D1) timeframe, BCH/USD has rallied sharply from recent lows near 212.98, climbing through key levels to push past 336.49 before settling near the latest close of 334.31. High volume during recent bullish candles reflects aggressive buyer participation, though price action shows slight deceleration below key high levels.
Key Technical Indicators:
Bollinger Bands: The D1 Bollinger Bands show significant expansion with the middle band at 254.18, upper band at 327.50, and lower band at 180.85. With the latest close at 334.31 trading above the upper band, the pair reflects strong upside volatility and potential overextended conditions.
RSI: The 14-period Daily RSI stands at 74.86, placing BCH/USD in overbought territory. While this underscores robust buying pressure, it also signals the potential for consolidation or temporary corrective retracements.
MACD: The D1 MACD main line sits firmly in positive territory at 20.20, confirming powerful bullish momentum in the recent price advance for BCHUSD.
Support and Resistance:
Key technical levels on the daily chart include major resistance at 361.71, representing the immediate hurdle for extended bullish moves, and fundamental support located down at 195.60.
News to Watch for BCHUSD This Week:
- ISM Manufacturing PMI: Evaluates activity levels in the manufacturing sector, impacting overall market risk appetite and US dollar movements.
- ISM Manufacturing Prices: Tracks price inflation within manufacturing, providing signals regarding monetary expectations that can filter into risk assets.
Weekly Outlook and Consideration:
BCH/USD enters the week with strong momentum, having surged to a close at 334.31. Technical indicators align with a strong rally, highlighted by a positive MACD of 20.20 and price trading above the 327.50 upper Bollinger Band. However, with the RSI at 74.86 indicating overbought conditions, traders should watch for potential pullbacks toward mid-band areas near 254.18 if resistance at 361.71 caps further immediate upside. A break above 361.71 could pave the way for continued bullish expansion, whereas a broader decline would bring focus back toward the support zone at 195.60.
Disclaimer: The analysis provided for BCH/USD is for informational purposes only and does not constitute investment advice. Traders are encouraged to perform their own analysis and research before making any trading decisions. Market conditions can change quickly, so staying informed with the latest data is essential.