Time Zone: GMT +3
Time Frame: Daily (D1) / Weekly Outlook
Weekly Fundamental Overview:
Broader macroeconomic conditions and shifts in US Dollar sentiment continue to influence overall liquidity across digital asset markets. Upcoming economic data releases regarding the labor market and inflation are expected to drive risk sentiment, indirectly impacting the momentum of LTC/USD.
Price Action:
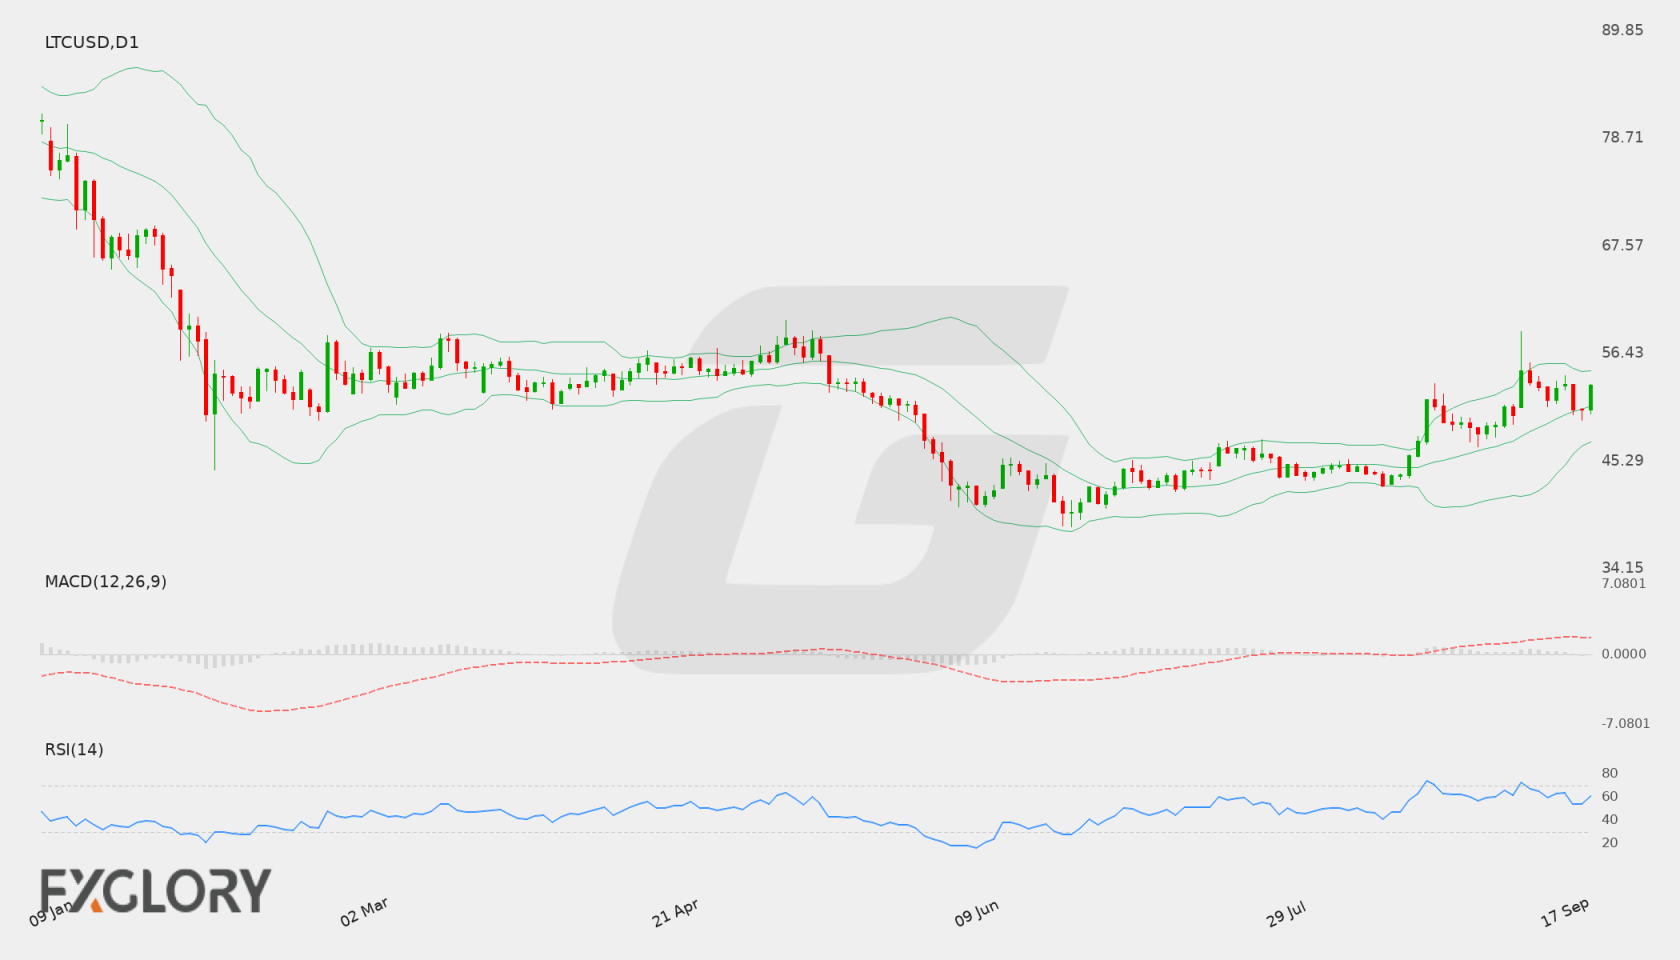
On the daily (D1) chart, LTC/USD recently closed at 53.13 after recovering from recent lows. The instrument has formed a steady series of higher closes, pushing toward the upper technical boundaries as bullish momentum attempts to establish control.
Key Technical Indicators:
Bollinger Bands: The Bollinger Bands display a middle line at 50.96, an upper band at 54.66, and a lower band at 47.26. Trading near 53.13 keeps LTC/USD comfortably above the middle boundary and approaching upper resistance.
RSI: The 14-day Relative Strength Index (RSI) stands at 60.48. Holding above the neutral 50 level, the oscillator indicates ongoing buying strength while remaining below overbought territory.
MACD: The MACD indicator is currently reading 1.58, maintaining a positive trajectory above the baseline and signaling active bullish momentum on the daily time frame.
Support and Resistance:
Key daily technical support is established at 39.24, while primary overhead resistance is located around 58.66.
News to Watch for LTCUSD This Week:
- CB Consumer Confidence: Shifts in consumer sentiment provide insights into US economic momentum and overall market risk tolerance.
- JOLTS Job Openings: Labor demand metrics influence broad expectations around central bank interest rate trajectories.
- ADP Non-Farm Employment Change: Private sector employment trends help gauge broader economic health and liquidity conditions.
- Core PCE Price Index m/m: Inflation measurements directly affect currency strength and broader asset price dynamics.
- Final GDP q/q: Comprehensive growth figures shape market sentiment regarding US economic stability.
- ISM Manufacturing PMI: Manufacturing activity trends serve as a key barometer for economic expansion or contraction.
- Average Hourly Earnings m/m: Wage growth indicators inform inflationary pressure and potential policy responses.
- Non-Farm Employment Change: Headline employment performance frequently triggers broad market volatility across asset classes.
- Unemployment Rate: Key labor metrics reflect overall macroeconomic stability and drive risk appetite.
Weekly Outlook and Consideration:
The weekly outlook for LTC/USD remains constructive, supported by an RSI above 50 and positive MACD values. If buying interest persists above the middle Bollinger Band at 50.96, LTCUSD could attempt a challenge toward the resistance zone near 58.66. Conversely, a turn lower could see the pair test the lower Bollinger Band around 47.26, with major structural support remaining at 39.24.
Disclaimer: The analysis provided for LTC/USD is for informational purposes only and does not constitute investment advice. Traders are encouraged to perform their own analysis and research before making any trading decisions. Market conditions can change quickly, so staying informed with the latest data is essential.