Time Zone: GMT +3
Time Frame: Daily (D1) / Weekly Outlook
Weekly Fundamental Overview:
Fundamental sentiment for USD/CHF is driven by economic developments in Switzerland and the United States. Key monetary policy updates from the Federal Reserve along with Swiss price indices provide the primary macro backdrop for the currency pair.
Price Action:
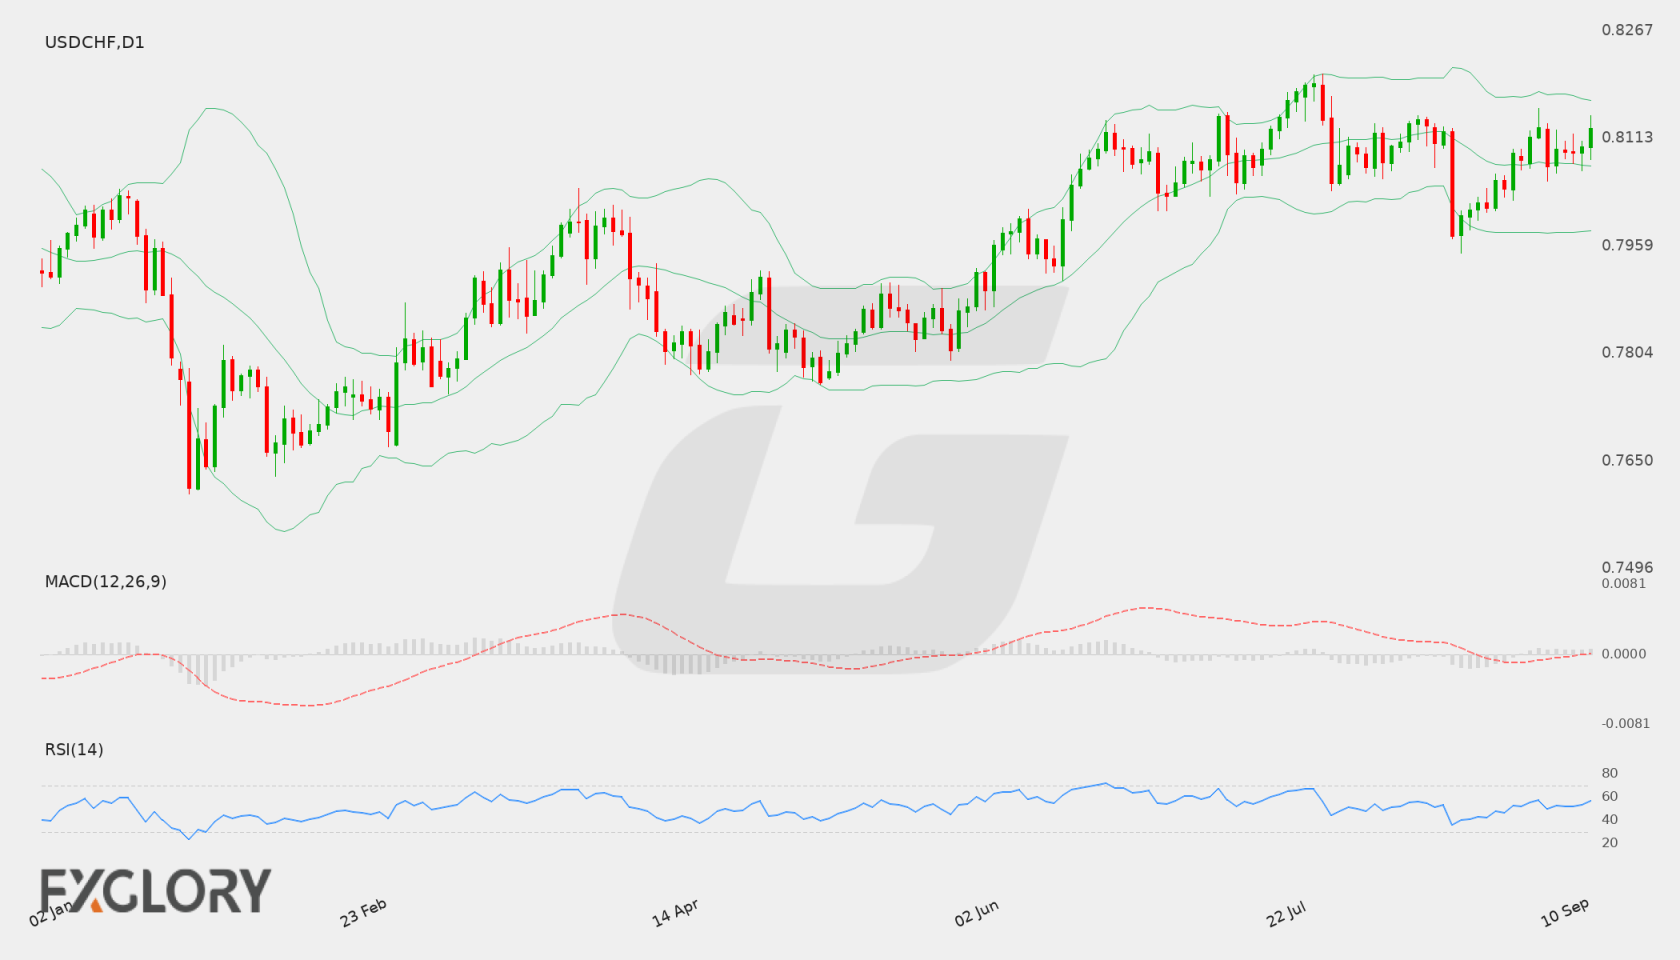
On the Daily (D1) chart, USD/CHF recently closed at 0.81266. The pair has demonstrated upward momentum over recent sessions, moving higher from the 0.80930 level toward current market prices.
Key Technical Indicators:
Bollinger Bands: The Bollinger Bands indicator shows a middle band at 0.80738, an upper band at 0.81677, and a lower band at 0.79799. With the latest close at 0.81266, USD/CHF is trading above the middle band and approaching the upper boundary.
RSI: The 14-period Relative Strength Index (RSI) stands at 56.55, placing USD/CHF in neutral to moderately bullish territory without entering overbought conditions.
MACD: The MACD indicator registers a positive value of 0.00067. This reading above zero indicates mild bullish momentum on the D1 timeframe.
Support and Resistance:
Technical analysis highlights key horizontal levels for USD/CHF on the Daily timeframe, with immediate support identified at 0.79483 and primary resistance located at 0.82054.
News to Watch for USDCHF This Week:
- PPI m/m: This release measures Swiss producer price changes and can influence Swiss Franc valuation.
- Core Retail Sales m/m: This metric reflects US consumer spending excluding volatile items and impacts US Dollar sentiment.
- Retail Sales m/m: Broad US retail sales data provides insight into overall economic health and dollar strength.
- FOMC Economic Projections: Federal Reserve projections offer medium-term outlooks on growth and interest rates.
- FOMC Statement: The policy statement details the Federal Reserve monetary stance.
- Federal Funds Rate: The interest rate decision directly affects US Dollar yield expectations.
- FOMC Press Conference: Leadership remarks clarify the monetary policy trajectory and drive market volatility.
- Unemployment Claims: Weekly jobless claims data provides a fresh look at US labor market conditions.
Weekly Outlook and Consideration:
USD/CHF trades at 0.81266, positioned above its D1 Bollinger middle band of 0.80738. Technical indicators show an RSI of 56.55 and a positive MACD of 0.00067, suggesting a constructive price structure. Traders will monitor key support at 0.79483 and resistance at 0.82054 alongside upcoming central bank policy updates.
Disclaimer: The analysis provided for USD/CHF is for informational purposes only and does not constitute investment advice. Traders are encouraged to perform their own analysis and research before making any trading decisions. Market conditions can change quickly, so staying informed with the latest data is essential.