Time Zone: GMT +3
Time Frame: Daily (D1) / Weekly Outlook
Weekly Fundamental Overview:
Gold (GOLD) is navigating key macroeconomic catalysts, with upcoming U.S. economic data releases and central bank announcements driving market sentiment. Investors are paying close attention to consumer spending indicators, monetary policy shifts, and labor market trends that could influence non-yielding bullion demand.
Price Action:
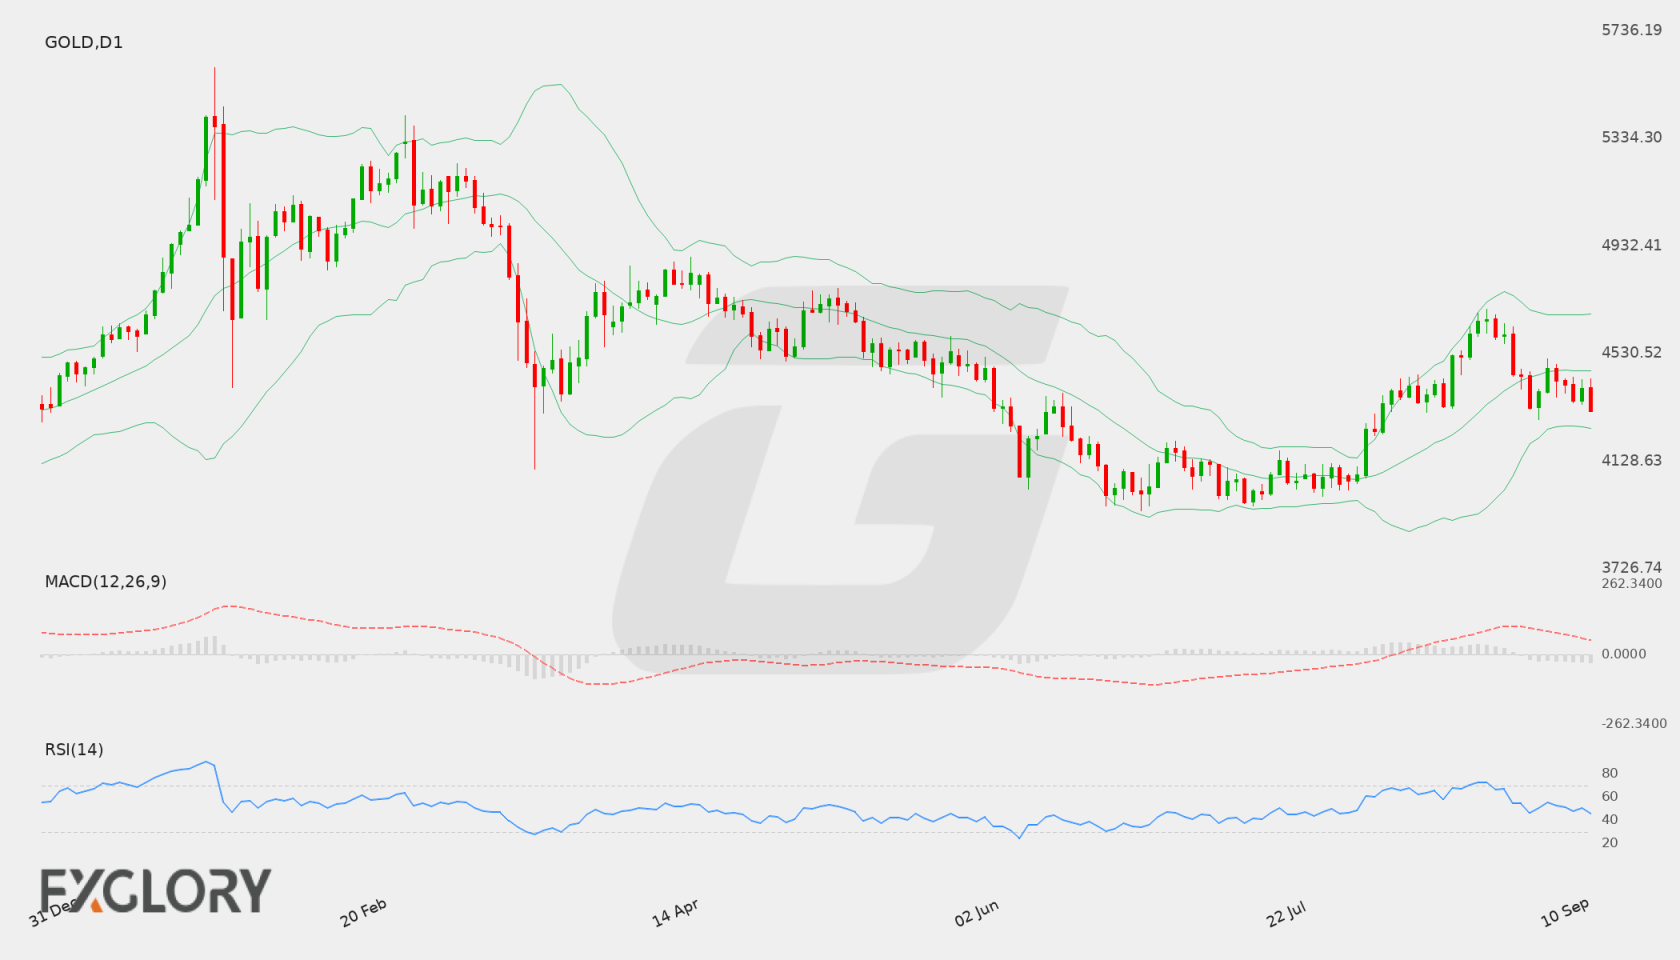
On the Daily (D1) chart, Gold (GOLD) settled at 4317.16 after pulling back from recent swing highs near 4696.65. The asset has shown increased downside pressure, testing lower boundaries after fluctuating between the 4300 and 4470 levels over recent trading sessions.
Key Technical Indicators:
Bollinger Bands: The Bollinger Bands indicator shows the middle band at 4464.21, with the upper band at 4676.92 and the lower band at 4251.50. With Gold trading at 4317.16 below the middle band, price action is drifting toward the lower envelope, indicating a moderate bearish tilt within the wider channel.
RSI: The 14-day Relative Strength Index (RSI) is recorded at 45.31. Operating in neutral territory below the 50 level, it highlights a slight bearish tilt without signaling oversold conditions.
MACD: The MACD line stands at 20.98. While remaining above the zero line, momentum has weakened compared to previous upward swings, reflecting diminishing bullish pressure as price consolidates downwards.
Support and Resistance:
Immediate technical resistance for Gold (GOLD) is located at 4696.65, while primary technical support is established at 3943.33.
News to Watch for GOLD This Week:
- Core Retail Sales m/m: Measures core consumer spending trends which can shift market sentiment and impact precious metals demand.
- Retail Sales m/m: Tracks broader consumer spending activity that influences economic outlooks and currency valuations.
- FOMC Economic Projections: Provides central bank forecasts on growth and inflation, affecting rate expectations.
- FOMC Statement: Offers insights into monetary policy stance and future rate decision trajectory.
- Federal Funds Rate: Details official policy interest rate decision which directly influences Gold non-yielding appeal.
- FOMC Press Conference: Features central bank commentary explaining monetary policy shifts and economic risks.
- Unemployment Claims: Indicates labor market strength and broader economic conditions impacting safe-haven appetite.
Weekly Outlook and Consideration:
Gold (GOLD) enters the week under mild downside pressure, trading at 4317.16 below its Daily middle Bollinger Band of 4464.21. Neutral RSI at 45.31 and an easing MACD at 20.98 suggest consolidation with potential for further testing toward the lower Bollinger Band around 4251.50 or key support at 3943.33. Conversely, a reversal back above 4464.21 could reopen momentum toward key resistance at 4696.65. Upcoming Federal Reserve announcements and retail sales figures will likely dictate short-term directional bias.
Disclaimer: The analysis provided for Gold is for informational purposes only and does not constitute investment advice. Traders are encouraged to perform their own analysis and research before making any trading decisions. Market conditions can change quickly, so staying informed with the latest data is essential.