Time Zone: GMT +3
Time Frame: Daily (D1) / Weekly Outlook
Weekly Fundamental Overview:
USD/MXN experiences continued downward momentum as the Mexican Peso maintains strength against the US Dollar. Market participants are monitoring US economic data and policy signals for potential shifts in currency valuation.
Price Action:
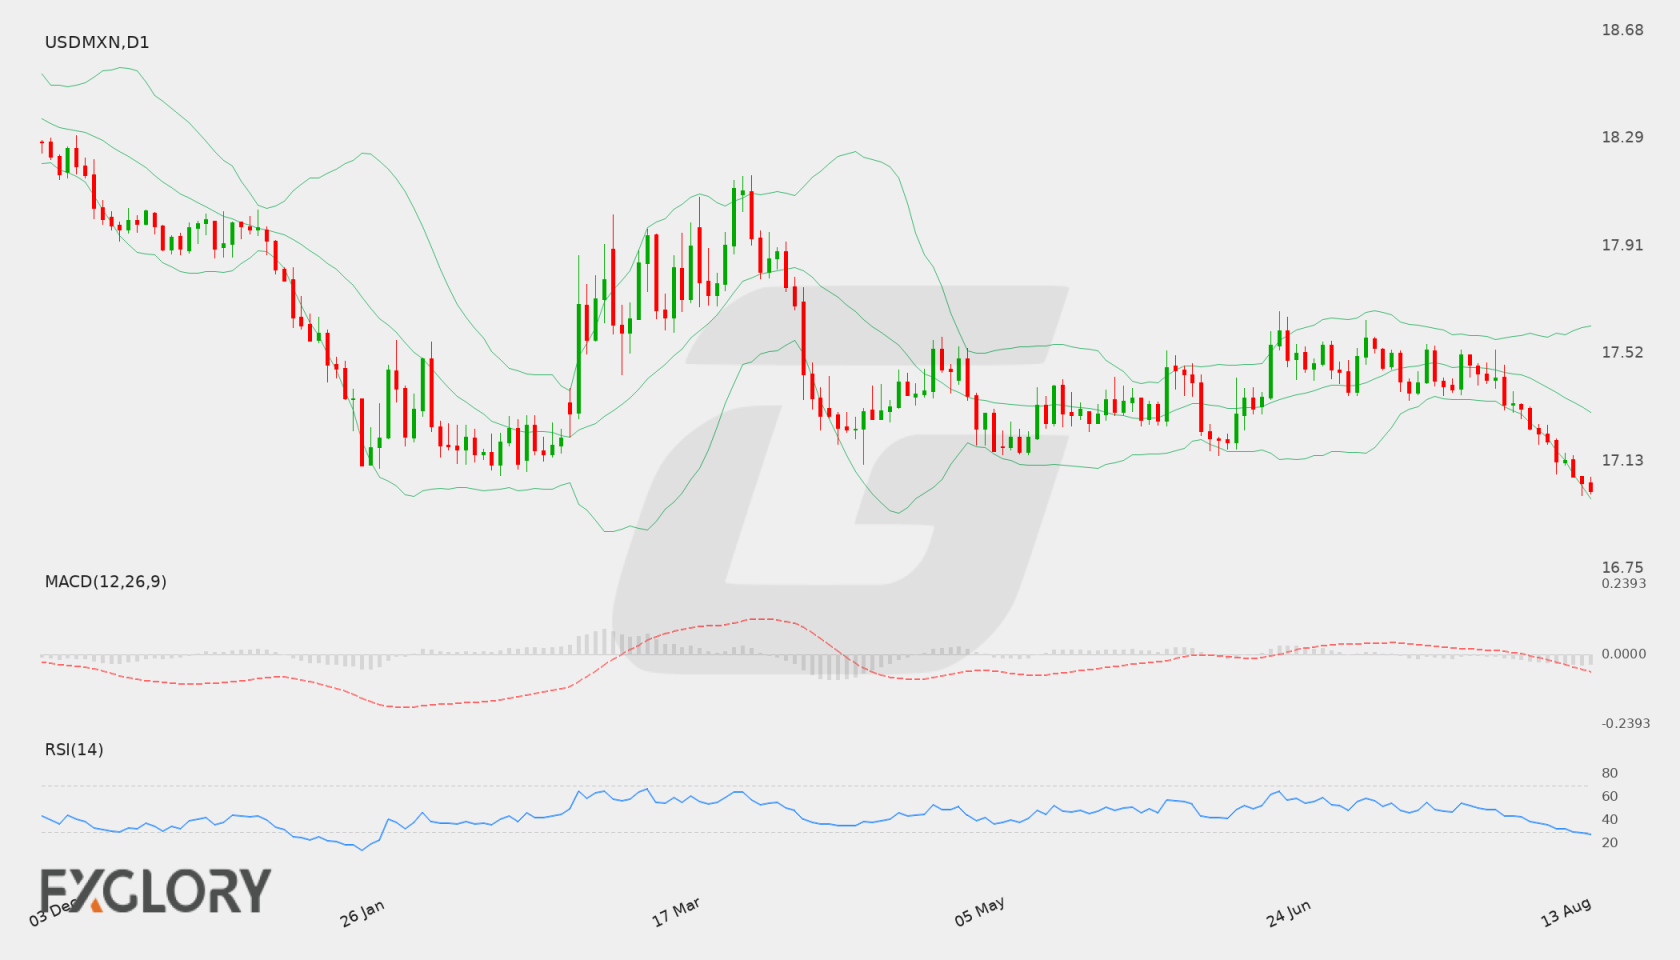
On the daily (D1) chart, USD/MXN (USDMXN) has demonstrated persistent selling pressure, moving lower to close at 17.024. Consecutive lower daily closes highlight sustained downside movement toward local support levels.
Key Technical Indicators:
Bollinger Bands: The D1 Bollinger Bands show USD/MXN trading near the lower band of 16.99699, well below the middle band of 17.30760. The upper band is positioned at 17.61821, reflecting elevated downside volatility.
RSI: The 14-period RSI stands at 27.26, placing USD/MXN in oversold conditions below the 30 level, which indicates stretched downside momentum.
MACD: The D1 MACD indicator for USD/MXN registers at -0.097937, remaining in negative territory and reflecting ongoing bearish momentum.
Support and Resistance:
Key daily technical levels for USD/MXN (USDMXN) include support at 17.00936 and resistance at 17.66976.
News to Watch for USDMXN This Week:
- Prelim Benchmark Payrolls Revision: This benchmark adjustment provides insights into US employment figures that may impact US dollar valuation.
- FOMC Meeting Minutes: The publication gives detailed background on monetary policy discussions affecting interest rate expectations.
- Unemployment Claims: Weekly jobless claims data serves as a measure of labor market strength and economic momentum.
- Philly Fed Manufacturing Index: This regional report offers operational statistics on manufacturing health within the US.
- Flash Manufacturing PMI: Preliminary survey results indicate early trends regarding US manufacturing sector expansion or contraction.
Weekly Outlook and Consideration:
USD/MXN (USDMXN) enters the week with a prevailing bearish bias on the D1 chart, marked by a close at 17.024 and a negative MACD reading of -0.097937. With the RSI at 27.26 indicating oversold conditions, the pair is trading close to its daily support level of 17.00936. If support holds, a technical pause could develop, whereas a break lower may extend the trend; overhead resistance remains set at 17.66976. Market focus will stay attuned to incoming economic updates.
Disclaimer: The analysis provided for USD/MXN is for informational purposes only and does not constitute investment advice. Traders are encouraged to perform their own analysis and research before making any trading decisions. Market conditions can change quickly, so staying informed with the latest data is essential.