Time Zone: GMT +3
Time Frame: Daily (D1) / Weekly Outlook
Weekly Fundamental Overview:
The NZD/CHF currency pair reflects market expectations tied to broader risk appetite and economic conditions impacting both the New Zealand Dollar and Swiss Franc. In the absence of targeted economic data on the calendar, market participants typically focus on general risk sentiment, relative yield expectations, and global macro trends to gauge direction. safe-haven demand or shifts in growth expectations can significantly influence price dynamics across currency pairs. Traders should keep an eye on upcoming economic developments that could alter market conditions for NZD/CHF.
Price Action:
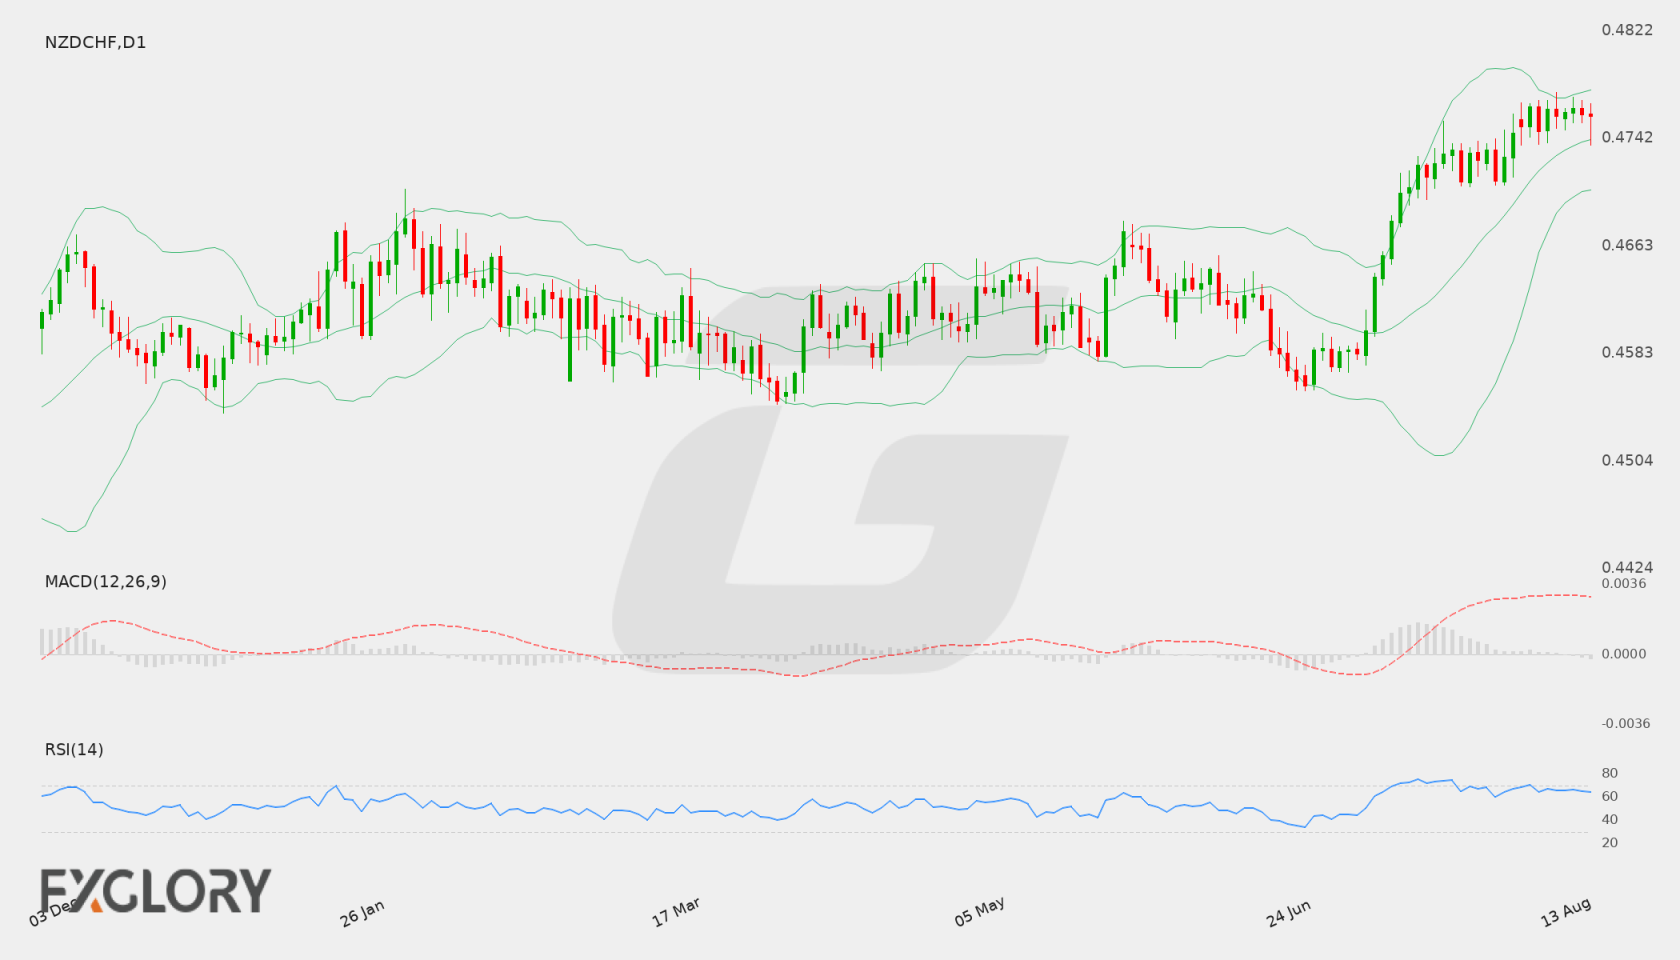
On the daily D1 timeframe, NZD/CHF has demonstrated a sustained upward move from lower levels below 0.4600, recently consolidating near the 0.47591 mark. Recent daily candles display steady buying interest, maintaining price action near the upper boundary of its short-term range. A consolidation phase near these highs suggests potential preparation for a retest of overhead resistance or a brief pause in momentum.
Key Technical Indicators:
Bollinger Bands: The daily Bollinger Bands highlight an upper band at 0.47780, a middle band (20-day SMA) at 0.47412, and a lower band at 0.47044. With the latest close at 0.47591, NZD/CHF trades in the upper half of the band structure, indicating prevailing upside pressure while staying just below upper band resistance.
RSI: The 14-period Relative Strength Index (RSI) stands at 64.02. This reading places the indicator comfortably above the neutral 50 level, reflecting clear bullish momentum while remaining below the overbought threshold of 70.
MACD: The daily MACD indicator registers a positive value of 0.00273. The MACD line remaining above its signal line in positive territory signals that bullish momentum continues to underpin the pair's price structure on the daily chart.
Support and Resistance:
Key daily technical levels for NZD/CHF feature primary resistance at 0.47761 and major support at 0.45558. Additionally, the middle Bollinger Band near 0.47412 serves as a closer dynamic support zone on minor pullbacks.
News to Watch for NZDCHF This Week:
- No specific events are available for this pair in the scheduled economic calendar. Traders may monitor generic high-impact releases, central bank comments, and broader risk sentiment for potential market impact.
Weekly Outlook and Consideration:
The technical posture for NZD/CHF remains leaning to the upside on the daily timeframe, supported by an RSI of 64.02 and a positive MACD reading of 0.00273. Should buyers maintain price above the middle Bollinger Band at 0.47412, a test of resistance at 0.47761 and the upper band at 0.47780 remains plausible. Conversely, a drop below middle band support could signal a broader cooling off period toward lower technical levels.
Disclaimer: The analysis provided for NZD/CHF is for informational purposes only and does not constitute investment advice. Traders are encouraged to perform their own analysis and research before making any trading decisions. Market conditions can change quickly, so staying informed with the latest data is essential.