Time Zone: GMT +3
Time Frame: Daily (D1) / Weekly Outlook
Weekly Fundamental Overview:
The fundamental backdrop for LTC/USD (LTCUSD) remains closely tied to broader market risk sentiment and movements in the US Dollar. As a major digital asset, Litecoin often reacts to broader liquidity expectations and macroeconomic releases from the United States, which dictate capital flows into risk-sensitive asset classes.
Price Action:
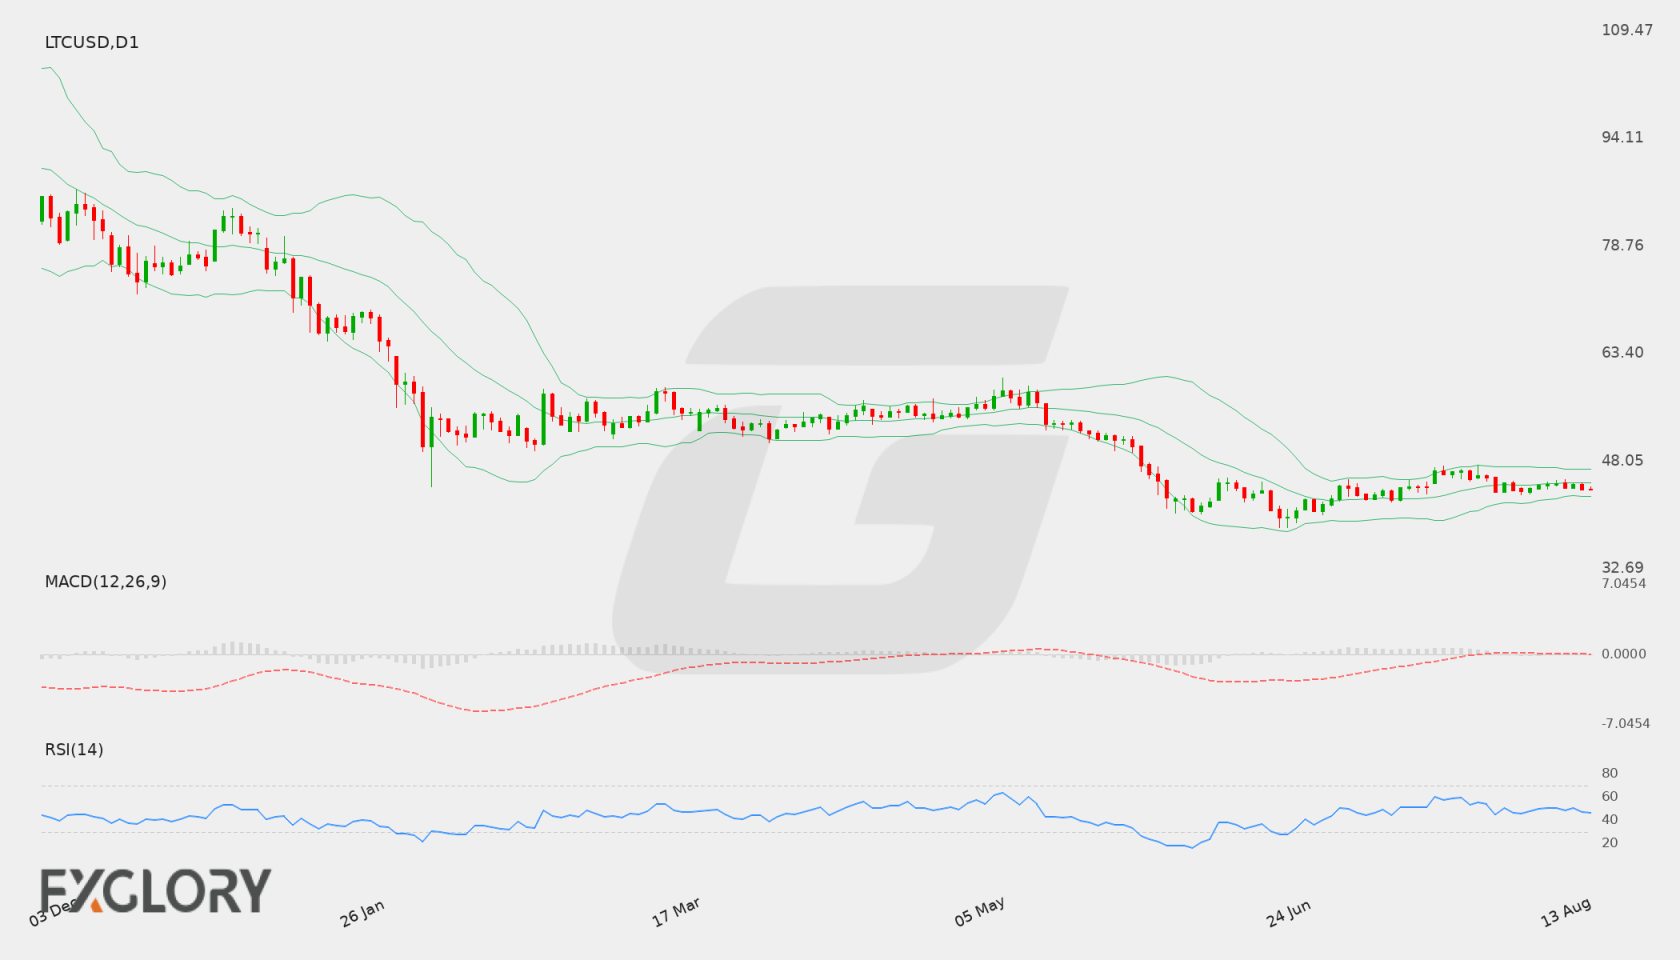
On the Daily (D1) chart, LTC/USD closed its latest trading session at 43.97. Price action has been consolidating within a tight range over recent sessions, staying bounded below recent daily highs while remaining above key multi-session swing lows as market participants evaluate direction.
Key Technical Indicators:
Bollinger Bands: The Daily Bollinger Bands indicate a middle band at 44.93, with an upper band at 46.90 and a lower band at 42.97. Trading at 43.97, LTC/USD is holding just beneath the 20-day middle band, pointing to mild downside pressure within a compressed volatility range.
RSI: The 14-day Relative Strength Index (RSI) stands at 46.51. Situated just below the 50 mark, the indicator reflects a neutral-to-soft tone without signaling overbought or oversold market conditions.
MACD: The MACD indicator is currently reading -0.09, remaining slightly below the zero baseline. This negative value reflects modest bearish momentum for LTCUSD, though the small amplitude indicates that seller momentum remains constrained.
Support and Resistance:
Key technical parameters for LTC/USD feature critical daily support at 38.49 and primary resistance at 53.76. Intermediate boundaries include the lower Bollinger Band around 42.97 on the downside and the middle Bollinger Band at 44.93 on the upside.
News to Watch for LTCUSD This Week:
- Prelim Benchmark Payrolls Revision: Shifts in US labor market assessments can influence overall risk sentiment across crypto markets.
- FOMC Meeting Minutes: Insights into Federal Reserve policy discussions could impact US dollar strength and crypto appetite.
- Unemployment Claims: Weekly labor trends offer fresh gauges on US economic health, potentially affecting risk-on assets.
- Philly Fed Manufacturing Index: Regional business indicators provide context on macroeconomic momentum influencing sentiment.
- Flash Manufacturing PMI: Preliminary manufacturing activity readings can drive market volatility across risk assets.
Weekly Outlook and Consideration:
The weekly outlook for LTC/USD points to a neutral consolidation structure around 43.97. Technical indicators show a balanced market with RSI at 46.51 and MACD near -0.09. If buyers reclaim the middle Bollinger Band at 44.93, LTCUSD could attempt a push toward the resistance zone near 53.76. Conversely, a drop below the lower Bollinger Band near 42.97 may open the door for a retest of support at 38.49.
Disclaimer: The analysis provided for LTC/USD is for informational purposes only and does not constitute investment advice. Traders are encouraged to perform their own analysis and research before making any trading decisions. Market conditions can change quickly, so staying informed with the latest data is essential.