Time Zone: GMT +3
Time Frame: Daily (D1) / Weekly Outlook
Weekly Fundamental Overview:
The USD/SGD pair reflects shifts in overall US dollar sentiment alongside macroeconomic factors influencing regional currencies. Market participants evaluate incoming economic data to gauge consumer spending momentum, which influences monetary policy expectations and relative currency strength between the US dollar and the Singapore dollar.
Price Action:
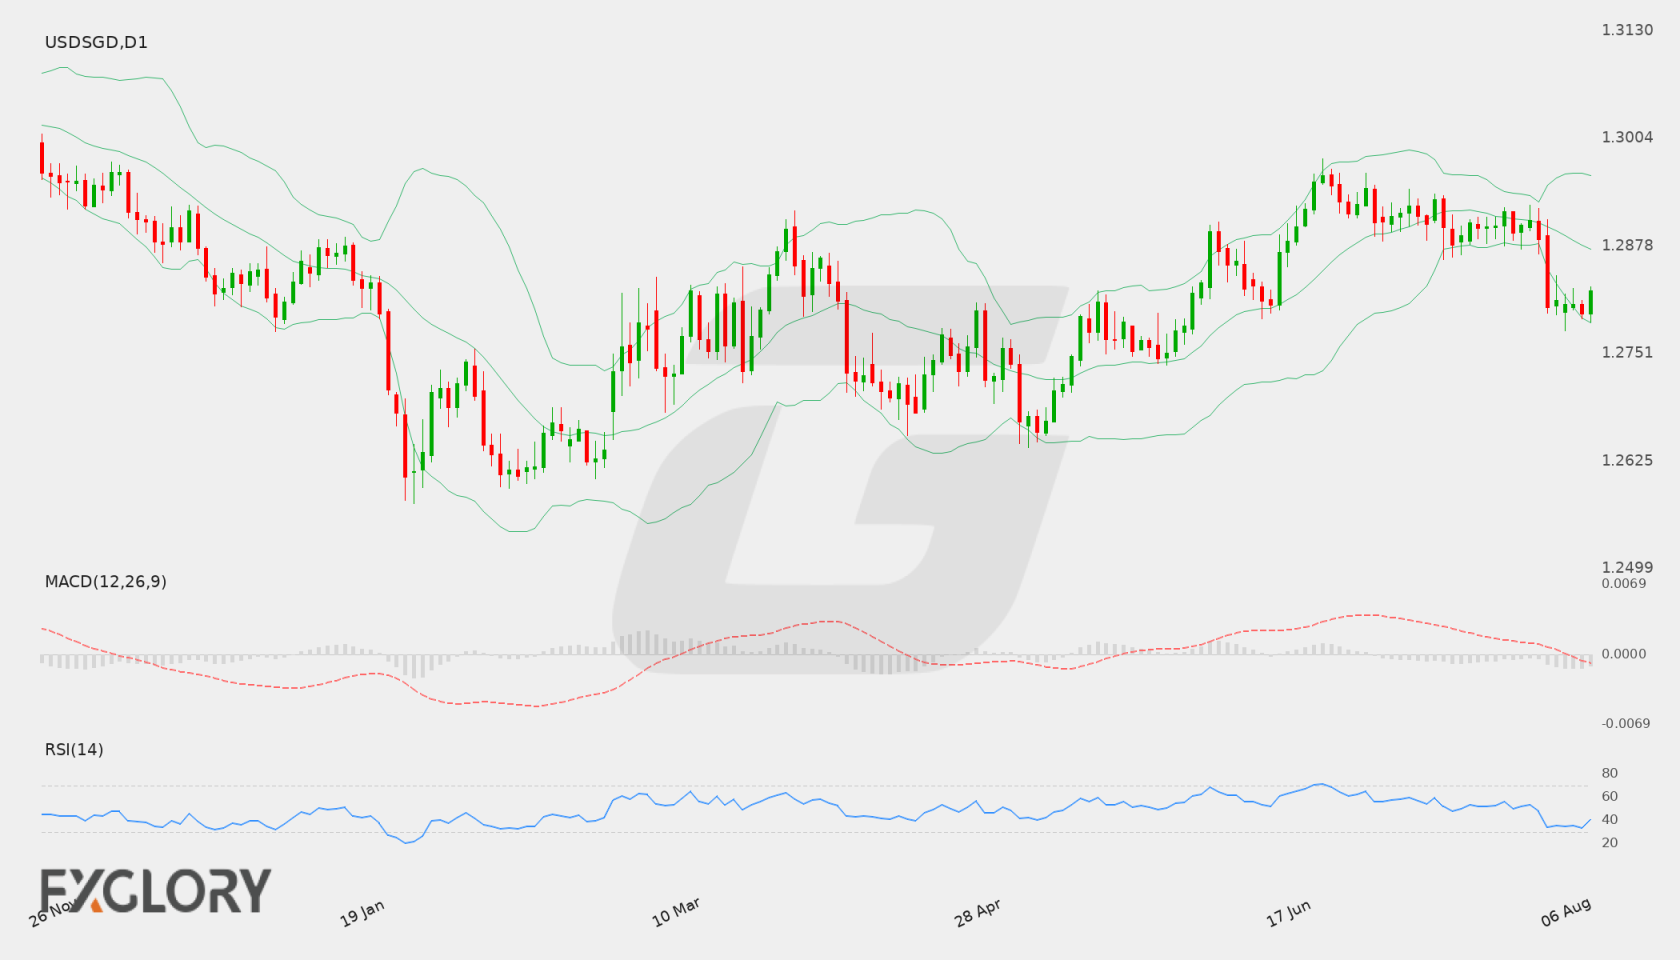
On the daily chart, USD/SGD recently pulled back from recent highs near 1.2907 toward the 1.2800 level before settling at 1.28247. The price action demonstrates recent downside momentum followed by consolidation near the lower end of the recent daily range.
Key Technical Indicators:
Bollinger Bands: The daily Bollinger Bands place the middle band at 1.28738, the upper band at 1.29601, and the lower band at 1.27874. Price action trading beneath the middle band signals an active short-term bearish bias, while remaining positioned above lower band support.
RSI: The 14-day RSI is registered at 40.70. Holding below the 50 neutral mark, the indicator reflects a mildly bearish sentiment without reaching oversold territory.
MACD: The daily MACD line reads -0.00204, holding below the zero threshold. This negative reading indicates that bearish momentum remains present in the current USD/SGD structure.
Support and Resistance:
Key technical levels for USD/SGD feature primary support at 1.27366 and strong resistance at 1.29797. On an intraday basis, the daily Bollinger middle band at 1.28738 acts as an intermediate resistance zone.
News to Watch for USDSGD This Week:
- Core Retail Sales m/m: Tracks monthly changes in US retail purchases excluding automotive sales to evaluate underlying consumer spending strength.
- Retail Sales m/m: Measures total US retail sales activity, providing key insights into consumer demand and broader dollar trend direction.
Weekly Outlook and Consideration:
USD/SGD enters the week with a neutral-to-bearish slant after closing at 1.28247. With the RSI at 40.70 and MACD below zero at -0.00204, price action remains constrained beneath the daily Bollinger middle band of 1.28738. Sustained pressure could direct the pair toward the lower support level at 1.27366. Alternatively, a move above 1.28738 could allow for a rebound toward resistance near 1.29797.
Disclaimer: The analysis provided for USD/SGD is for informational purposes only and does not constitute investment advice. Traders are encouraged to perform their own analysis and research before making any trading decisions. Market conditions can change quickly, so staying informed with the latest data is essential.