Time Zone: GMT +3
Time Frame: Daily (D1) / Weekly Outlook
Weekly Fundamental Overview:
Fundamental market drivers for USD/NOK continue to center on economic trajectory differences between the US and Norway, alongside global market risk sentiment and energy market trends. Key US economic data releases, particularly regarding consumer behavior and inflation expectations, remain critical drivers for USD sentiment.
Price Action:
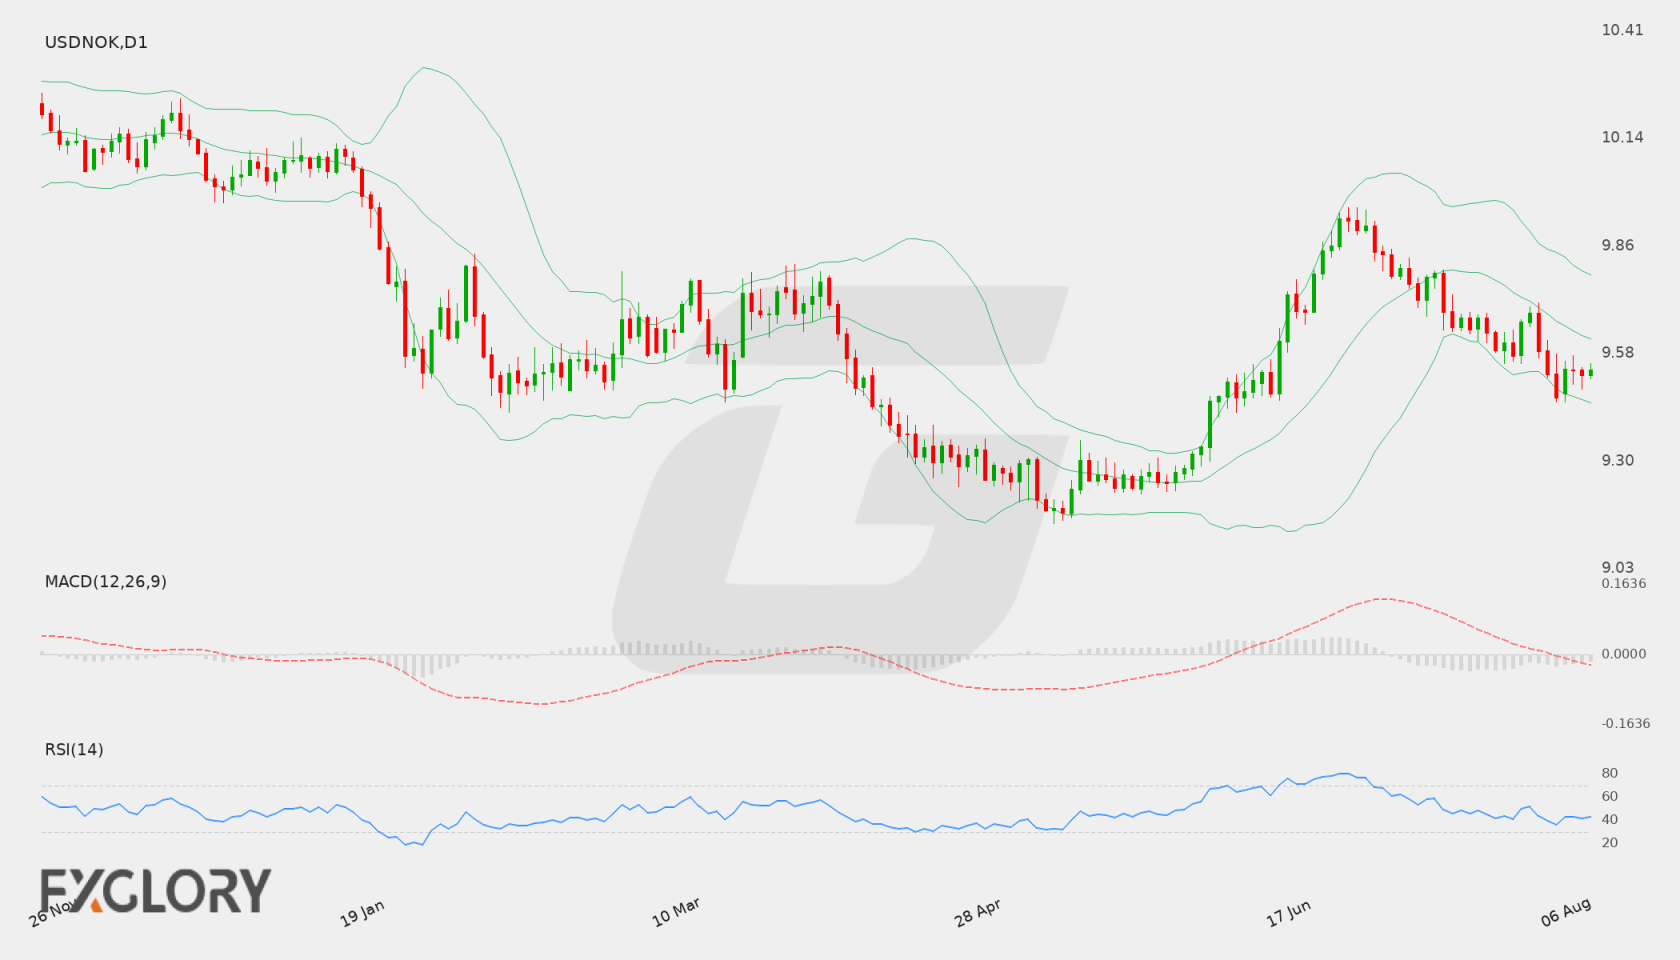
On the daily D1 chart, USD/NOK recently closed at 9.53886. Price action shows a recent pull back from levels near 9.68567 down toward a low of 9.46777 before consolidating near the current level. The pair currently trades below its middle Bollinger band, maintaining a subdued structure.
Key Technical Indicators:
Bollinger Bands: The Bollinger Bands technical assessment places the middle band at 9.61864, the upper band at 9.78312, and the lower band at 9.45417. With USD/NOK trading at 9.53886, price remains positioned between the middle and lower bands, pointing to persistent downside tilt within the band structure.
RSI: The 14-period Relative Strength Index (RSI) is recorded at 42.99. Positioned below the neutral 50 level, the reading reflects modest selling pressure without reaching oversold conditions.
MACD: The daily MACD histogram and line indicator stands at -0.03957. Remaining below the zero line confirms ongoing bearish momentum for USD/NOK over the recent timeframe.
Support and Resistance:
Technical chart analysis highlights primary support at 9.21798 and primary resistance at 9.95824. Nearer term, the lower Bollinger band around 9.45417 acts as immediate downside threshold, while the middle Bollinger band at 9.61864 serves as initial overhead resistance.
News to Watch for USDNOK This Week:
- Core Retail Sales m/m: This report provides crucial insights into US consumer demand excluding volatile components, impacting broader sentiment surrounding the US Dollar.
- Retail Sales m/m: This fundamental indicator measures overall headline consumer spending changes, which can trigger volatility across USD currency pairs.
Weekly Outlook and Consideration:
The weekly technical outlook for USD/NOK leans moderately cautious to bearish while the pair trades below the middle Bollinger band at 9.61864. If buyers push price above this level, USD/NOK could extend momentum toward primary resistance at 9.95824. Conversely, failure to maintain support above the 9.45417 lower band region could expose key support at 9.21798.
Disclaimer: The analysis provided for USD/NOK is for informational purposes only and does not constitute investment advice. Traders are encouraged to perform their own analysis and research before making any trading decisions. Market conditions can change quickly, so staying informed with the latest data is essential.