Time Zone: GMT +4
Time Frame: 4 Hours (H4)
Fundamental Analysis:
Economic calendar events are currently not scheduled for USD/SGD (USDSGD) in the tracked dataset. Market participants are observing broader market conditions as technical factors drive current price behavior on the H4 chart.
Price Action:
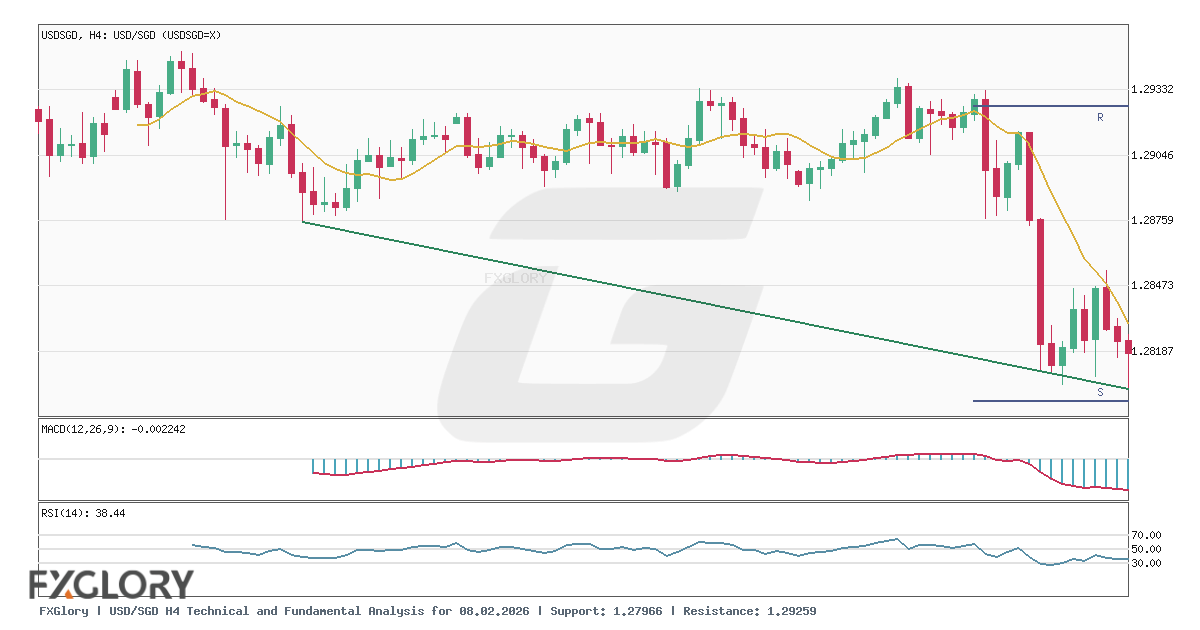
On the H4 chart, USD/SGD (USDSGD) recently dropped from recent highs near 1.29174 down to a low of 1.27966, before settling at a last close of 1.28196. The series of recent candles reflects heightened selling momentum followed by a modest pause above local support.
Key Technical Indicators:
Bollinger Bands(20,2.000): The Bollinger Bands indicator shows USD/SGD trading near the lower band, which is located at 1.27870. The middle band sits at 1.28715, while the upper band is placed at 1.29560.
MACD(12,26,9): The MACD indicator on the H4 timeframe registers at -0.00224, operating in negative territory. This indicates that short-term bearish momentum remains active.
RSI(14): The 14-period Relative Strength Index (RSI) stands at 38.44. This value keeps USD/SGD in a lower neutral zone, reflecting recent downside price movement without reaching deep oversold conditions.
Support and Resistance:
Technical support for USD/SGD (USDSGD) on the H4 chart is identified at 1.27966, backed by the lower Bollinger Band at 1.27870. Overhead resistance is marked at 1.29259, with the middle Bollinger Band at 1.28715 serving as a interim dynamic barrier.
Conclusion and Consideration:
USD/SGD (USDSGD) maintains a weak posture on the H4 timeframe after closing at 1.28196. With the RSI at 38.44 and the MACD at -0.00224, traders are watching how price acts near the support level of 1.27966 and resistance at 1.29259.
Disclaimer: The analysis provided for USD/SGD is for informational purposes only and does not constitute investment advice. Traders are encouraged to perform their own analysis and research before making any trading decisions. Market conditions can change quickly, so staying informed with the latest data is essential.