Time Zone: GMT +4
Time Frame: 4 Hours (H4)
Fundamental Analysis:
With no economic calendar events listed in the supplied data, fundamental catalysts for NZD/CHF (NZDCHF) remain neutral, leaving short-term movements driven by technical technical dynamics on the H4 timeframe.
Price Action:
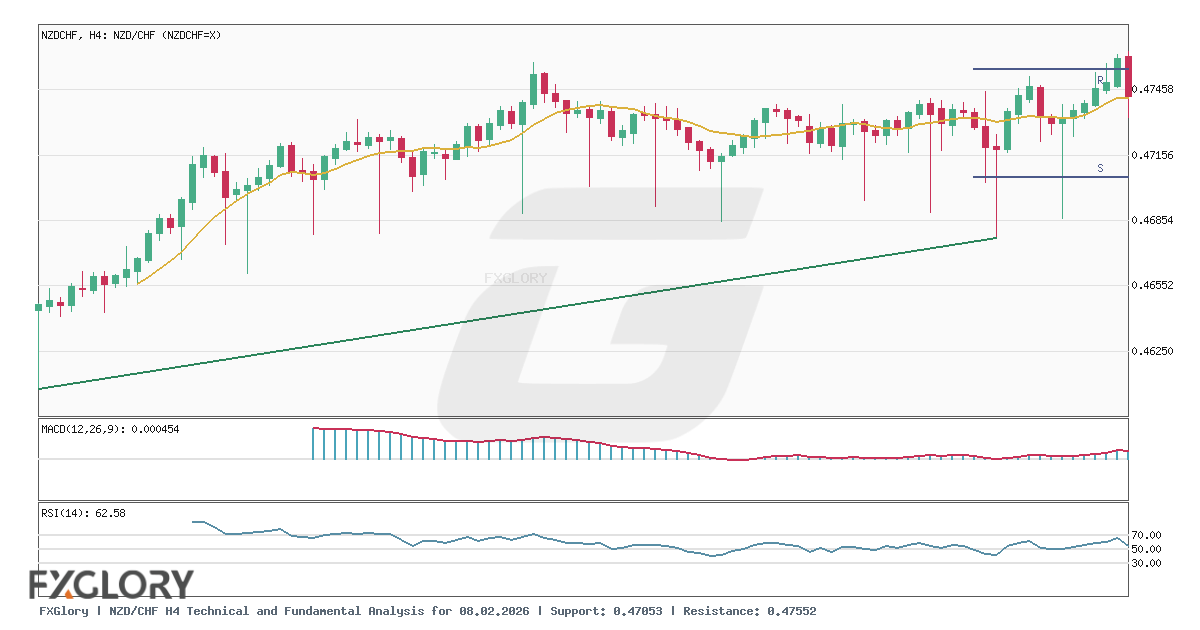
Price action on the NZD/CHF (NZDCHF) H4 chart displays a consistent upward progression. Recent candle closes moved higher from 0.47326 to 0.47408, 0.47455, and settled at a last close of 0.47515.
Key Technical Indicators:
Bollinger Bands(20,2.000): The Bollinger Bands technical setup shows a middle band at 0.47326, a lower band at 0.47148, and an upper band at 0.47504. The latest close of 0.47515 sits just above the upper band, indicating strong buying pressure.
MACD(12,26,9): The MACD indicator is currently reading a positive 0.00045, which aligns with the upward bias observed across recent four-hour sessions.
RSI(14): The 14-period RSI is situated at 62.58, indicating steady bullish momentum while staying under extreme overbought territory.
Support and Resistance:
Technical support for NZDCHF is identified at 0.47053, while primary resistance stands overhead at 0.47552.
Conclusion and Consideration:
NZD/CHF shows bullish momentum on the H4 timeframe, trading near its resistance level of 0.47552 and above the middle Bollinger Band at 0.47326. A sustained move could test resistance further, whereas a reversal may bring support at 0.47053 into focus.
Disclaimer: The analysis provided for NZD/CHF is for informational purposes only and does not constitute investment advice. Traders are encouraged to perform their own analysis and research before making any trading decisions. Market conditions can change quickly, so staying informed with the latest data is essential.