Time Zone: GMT +4
Time Frame: 4 Hours (H4)
Fundamental Analysis:
With no scheduled calendar events provided in the dataset for NZD/CAD (NZDCAD), price behavior on the H4 timeframe is currently driven by technical market structure and existing momentum.
Price Action:
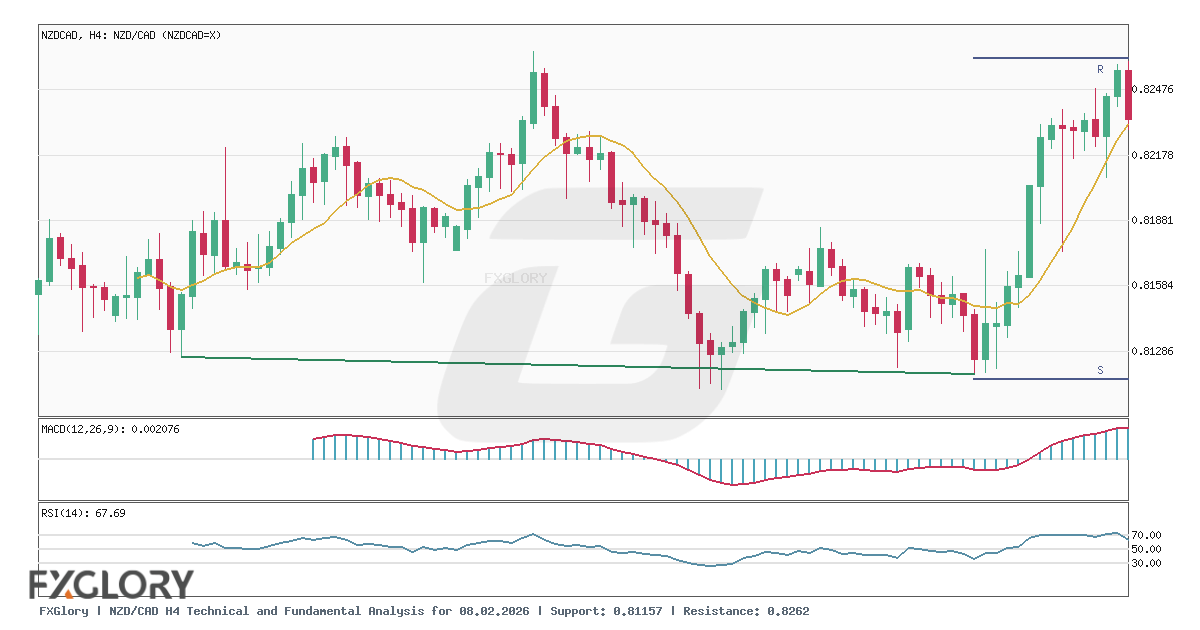
The H4 chart for NZD/CAD shows an upward trend over recent sessions, ascending from lows near 0.81239 to a latest close of 0.82442. Bullish candles dominate the recent sequence, reflecting steady buying interest.
Key Technical Indicators:
Bollinger Bands(20,2.000): The Bollinger Bands display a middle line at 0.81790, an upper band at 0.82593, and a lower band at 0.80987. Trading at 0.82442, NZDCAD is positioned close to the upper band, confirming an active bullish expansion.
MACD(12,26,9): The MACD value is positive at 0.002076, pointing to persistent upward momentum and reinforcing the prevailing buying pressure on the 4-hour chart.
RSI(14): The 14-period RSI sits at 67.69, approaching the overbought boundary of 70. This reflects solid upside strength without officially entering overbought territory.
Support and Resistance:
Key technical benchmarks for NZD/CAD include major resistance at 0.82620 and primary support located at 0.81157.
Conclusion and Consideration:
NZD/CAD (NZDCAD) maintains a bullish outlook on the H4 chart, closing at 0.82442 near resistance at 0.82620. Traders should monitor how price responds to this upper barrier and the middle Bollinger level at 0.81790.
Disclaimer: The analysis provided for NZD/CAD is for informational purposes only and does not constitute investment advice. Traders are encouraged to perform their own analysis and research before making any trading decisions. Market conditions can change quickly, so staying informed with the latest data is essential.