Time Zone: GMT +4
Time Frame: 4 Hours (H4)
Fundamental Analysis:
With no scheduled macroeconomic events provided in the calendar data, AUD/JPY (AUDJPY) market participants are primarily observing technical indicator alignments and price levels on the H4 timeframe.
Price Action:
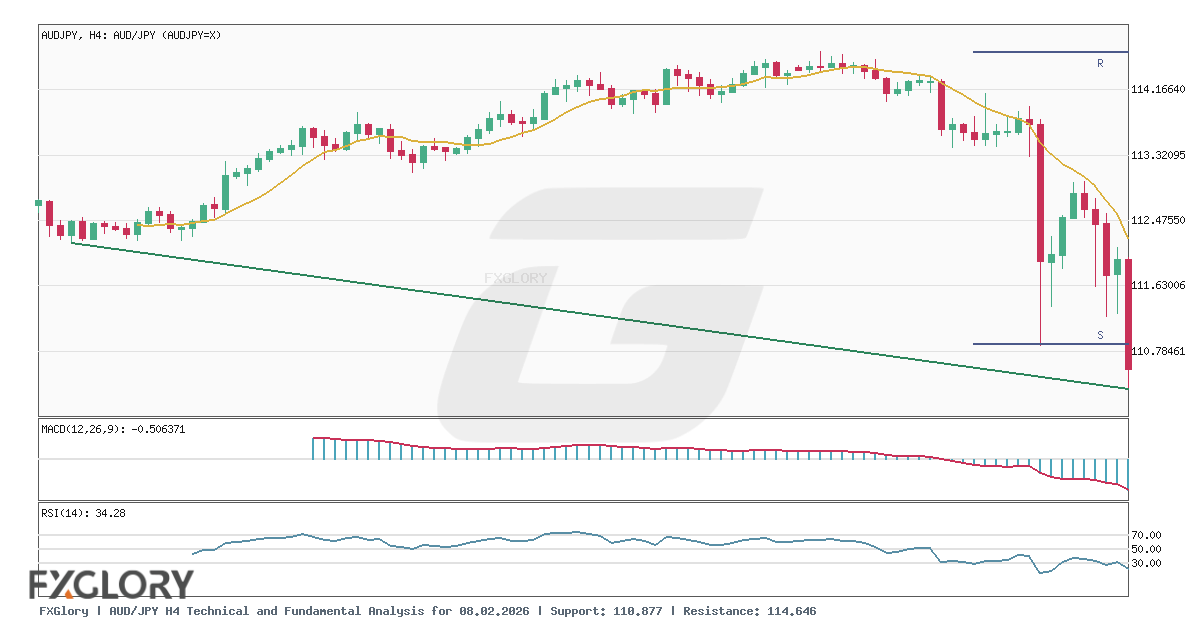
The AUD/JPY pair last closed at 111.931. Recent H4 price action shows a significant drop from high levels near 114.646 down to a session low of 110.877, followed by a slight rebound, with the most recent candle fluctuating between a high of 112.547 and a low of 111.220 before settling at 111.931.
Key Technical Indicators:
Bollinger Bands(20,2.000): The H4 Bollinger Bands show a middle band at 113.287, an upper band at 114.870, and a lower band at 111.705. The current price of AUDJPY at 111.931 is positioned close to the lower Bollinger Band.
MACD(12,26,9): The H4 MACD indicator currently reads -0.506, remaining in negative territory and highlighting underlying downside momentum for AUD/JPY.
RSI(14): The 14-period Relative Strength Index (RSI) for AUD/JPY stands at 34.28, reflecting bearish sentiment as it approaches the oversold threshold.
Support and Resistance:
Key technical chart levels for AUD/JPY (AUDJPY) show immediate support around 110.877, while resistance is identified around 114.646.
Conclusion and Consideration:
AUD/JPY (AUDJPY) is currently navigating lower levels near 111.931 with an RSI of 34.28 and MACD at -0.506. Traders are keeping a close watch on the key support level at 110.877 and resistance at 114.646 for further price developments.
Disclaimer: The analysis provided for AUD/JPY is for informational purposes only and does not constitute investment advice. Traders are encouraged to perform their own analysis and research before making any trading decisions. Market conditions can change quickly, so staying informed with the latest data is essential.