Time Zone: GMT +4
Time Frame: 4 Hours (H4)
Fundamental Analysis:
There are no economic calendar events listed in the provided data for XRP/USD (XRPUSD). In the absence of major fundamental releases, price dynamics are driven predominantly by technical trends and broader market sentiment.
Price Action:
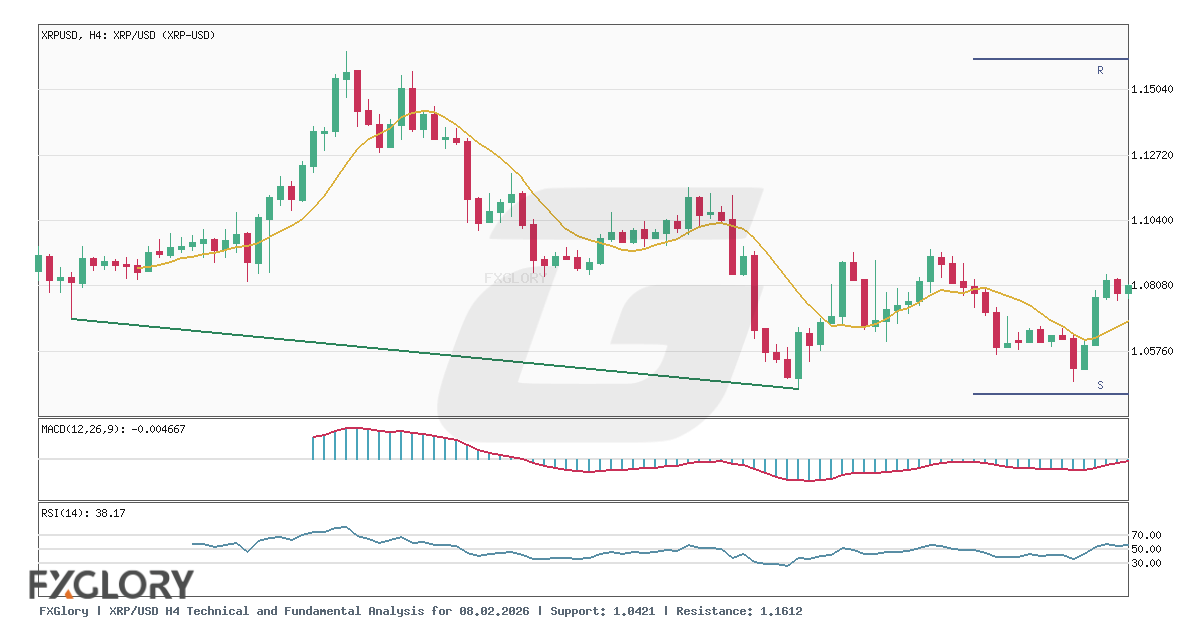
On the H4 chart, XRP/USD recently drifted lower, closing at 1.0601 after retreating from a high of 1.0869 in earlier sessions. The recent sequence of candles reflects short-term downward movement, keeping price action under pressure.
Key Technical Indicators:
Bollinger Bands(20,2.000): The Bollinger Bands indicator displays a middle boundary at 1.0714, an upper band at 1.0898, and a lower band at 1.0530. Trading at 1.0601, XRPUSD resides between the middle line and lower band, reflecting bearish characteristics.
MACD(12,26,9): The MACD indicator is currently recorded at -0.00467. Holding in negative territory, the MACD indicates that bearish momentum remains intact for the XRP/USD pair on the H4 timeframe.
RSI(14): The 14-period RSI stands at 38.17. This reading sits below the neutral 50 level, pointing to prevailing selling pressure while remaining above the standard oversold threshold of 30.
Support and Resistance:
Immediate key technical levels for XRP/USD show technical support identified at 1.0421 and key resistance positioned at 1.1612.
Conclusion and Consideration:
The H4 technical setup for XRP/USD displays moderate bearish sentiment, with prices trading below the 1.0714 middle Bollinger Band and an RSI of 38.17. Price action remains framed between key support at 1.0421 and resistance at 1.1612.
Disclaimer: The analysis provided for XRP/USD is for informational purposes only and does not constitute investment advice. Traders are encouraged to perform their own analysis and research before making any trading decisions. Market conditions can change quickly, so staying informed with the latest data is essential.