Time Zone: GMT +4
Time Frame: 4 Hours (H4)
Fundamental Analysis:
With no scheduled macroeconomic events present in the provided calendar data, trading momentum for ETH/USD (ETHUSD) is primarily guided by technical chart developments.
Price Action:
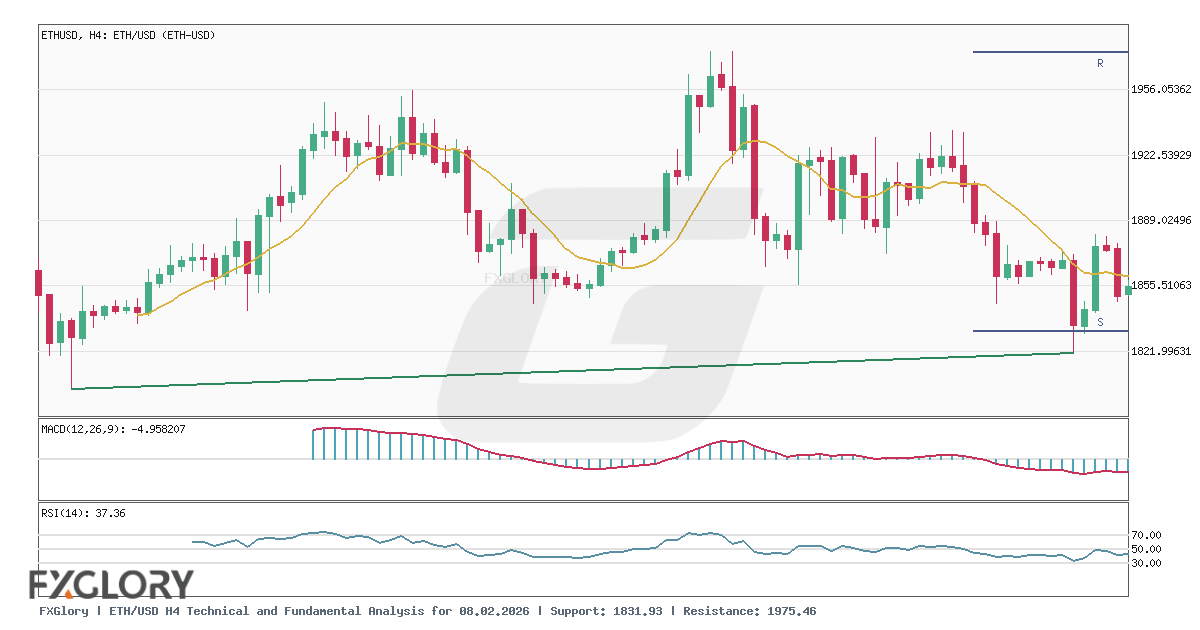
The H4 chart shows ETH/USD (ETHUSD) extending a recent pull-back, moving down from levels near 1917.70 and 1901.90 to 1878.54 before closing at 1860.71, with a period low hitting 1843.97.
Key Technical Indicators:
Bollinger Bands(20,2.000): The Bollinger Bands establish a middle line at 1900.86, an upper boundary at 1932.68, and a lower boundary at 1869.04. The last close of 1860.71 resides below the lower band, reflecting strong recent downside motion.
MACD(12,26,9): The MACD indicator is currently recorded at -4.96, reflecting ongoing negative momentum in the H4 time frame.
RSI(14): The 14-period RSI is reading at 37.36, indicating a bearish sentiment that approaches oversold territory while staying above 30.
Support and Resistance:
Identified technical boundaries display primary support at 1831.93 and overhead resistance at 1975.46.
Conclusion and Consideration:
ETH/USD (ETHUSD) exhibits short-term bearish pressure on the H4 chart, with price settling at 1860.71. Key technical references to monitor include support at 1831.93 and resistance at 1975.46.
Disclaimer: The analysis provided for ETH/USD is for informational purposes only and does not constitute investment advice. Traders are encouraged to perform their own analysis and research before making any trading decisions. Market conditions can change quickly, so staying informed with the latest data is essential.