
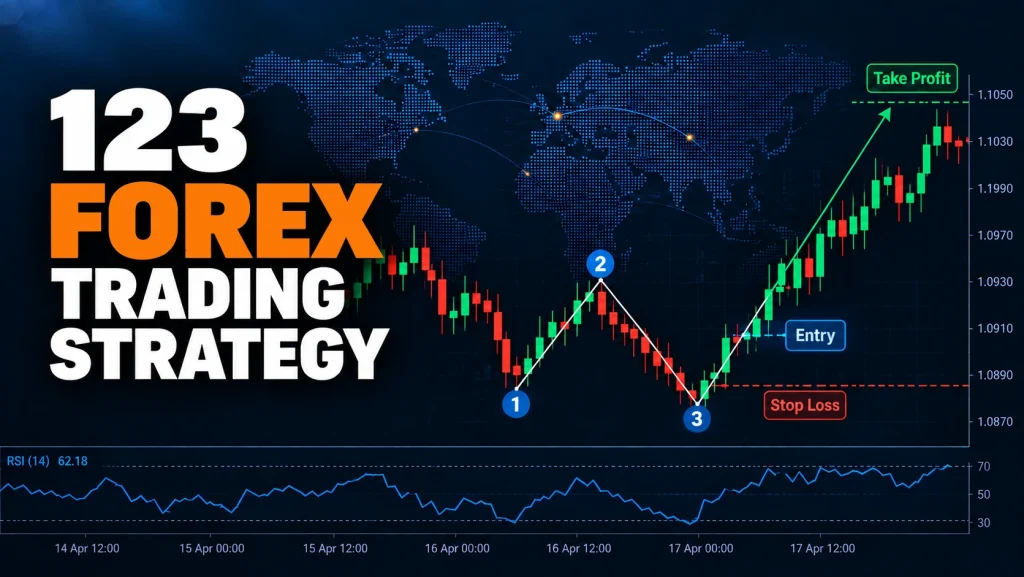
Backtest Overview and Pair-Level Variation
The historical model on this page produced mixed results rather than a universal success rate. Across 1,512 trades from 2014 to 2024, the combined win rate was 31.88%, expectancy was -0.258R, and profit factor was 0.53. Under those rules and assumptions, the combined result was negative.
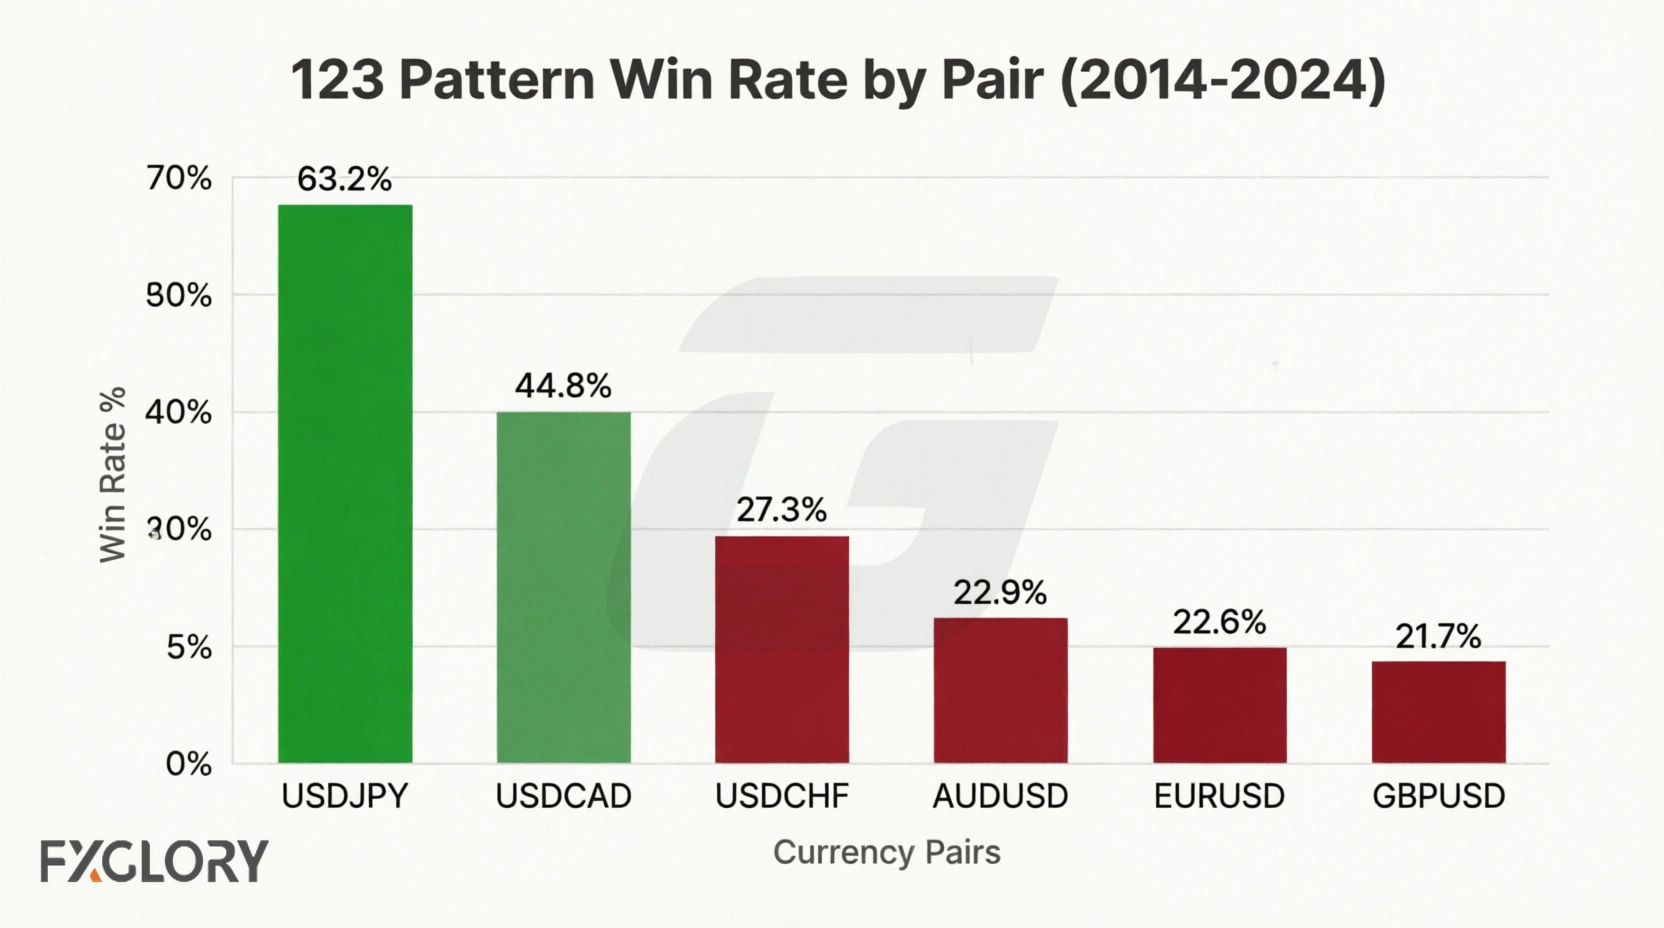
Pair-level outcomes varied substantially: USDJPY and USDCAD were positive in this test, while EURUSD, GBPUSD, AUDUSD, and USDCHF were negative. That variation is useful for evaluating the model, but it does not prove that the 123 pattern is inherently good or bad on any pair. A different swing definition, stop method, target, timeframe, or cost model could produce different results.
The worst losing streak in the combined test was 19 trades, which highlights why risk management matters even when a chart pattern looks structurally clear.
The Anatomy: Defining P1, P2, and P3 Structurally
The 123 pattern is a three-swing price structure. For a bullish reversal setup:
- Point 1: The initial swing low that ends the prior downswing.
- Point 2: The reaction high that follows Point 1 and later becomes the breakout level.
- Point 3: A later swing low that remains above Point 1. If Point 3 breaks below Point 1, the bullish reversal structure is invalidated.
A bullish setup is commonly confirmed when price breaks above Point 2 after Point 3 has formed. A bearish 123 uses the inverse structure: an initial swing high, a reaction low, and a lower high before a break below Point 2.
The Tested 10-30 Bar and 50% Retracement Filter
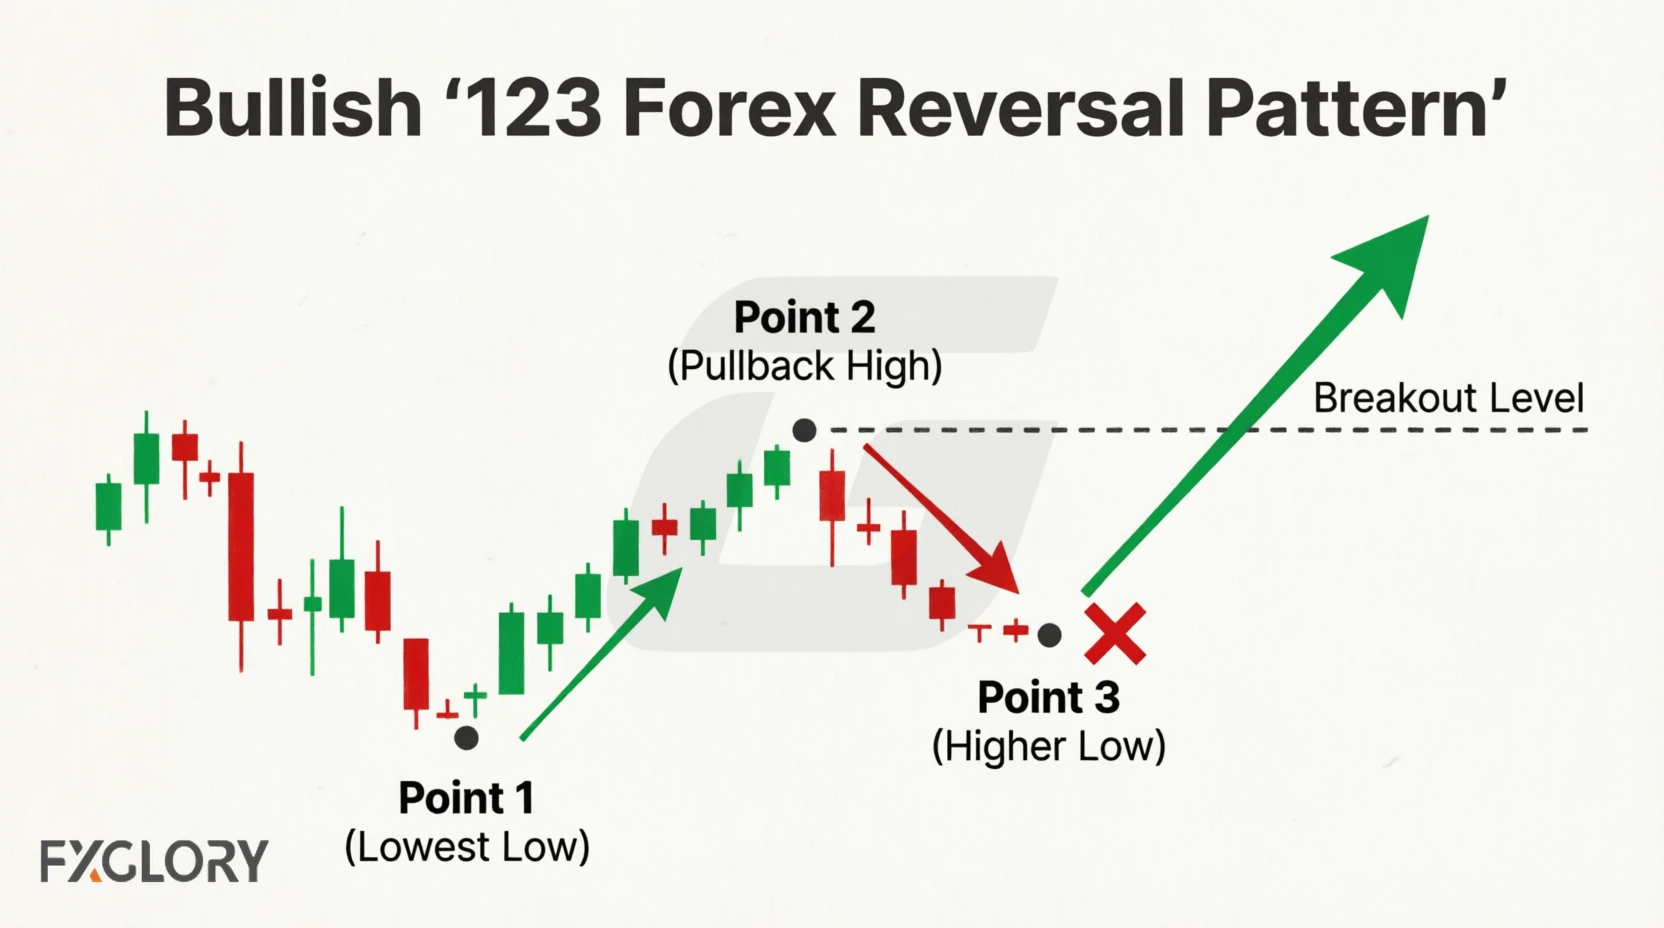
The backtest did not test every visually recognizable 123 pattern. It applied two additional eligibility rules: Point 1 and Point 3 had to be separated by 10 to 30 bars, and Point 2 had to satisfy a minimum 50% retracement condition. These thresholds are model parameters used to make the test reproducible.
| Test Filter | Rule Used | Purpose in the Model |
|---|---|---|
| P1-to-P3 distance | 10-30 bars | Limits the swing sequence to a defined time window. |
| Point 2 retracement | At least 50% | Requires a minimum pullback depth before the Point 3 swing is evaluated. |
This differs from the commonly repeated “10-20-50” label used in some trading discussions. The actual historical model supplied with this article used a 10-30 bar range, so the backtest should be interpreted according to the implemented rule rather than the label.
Entry Methods and What Was Actually Tested
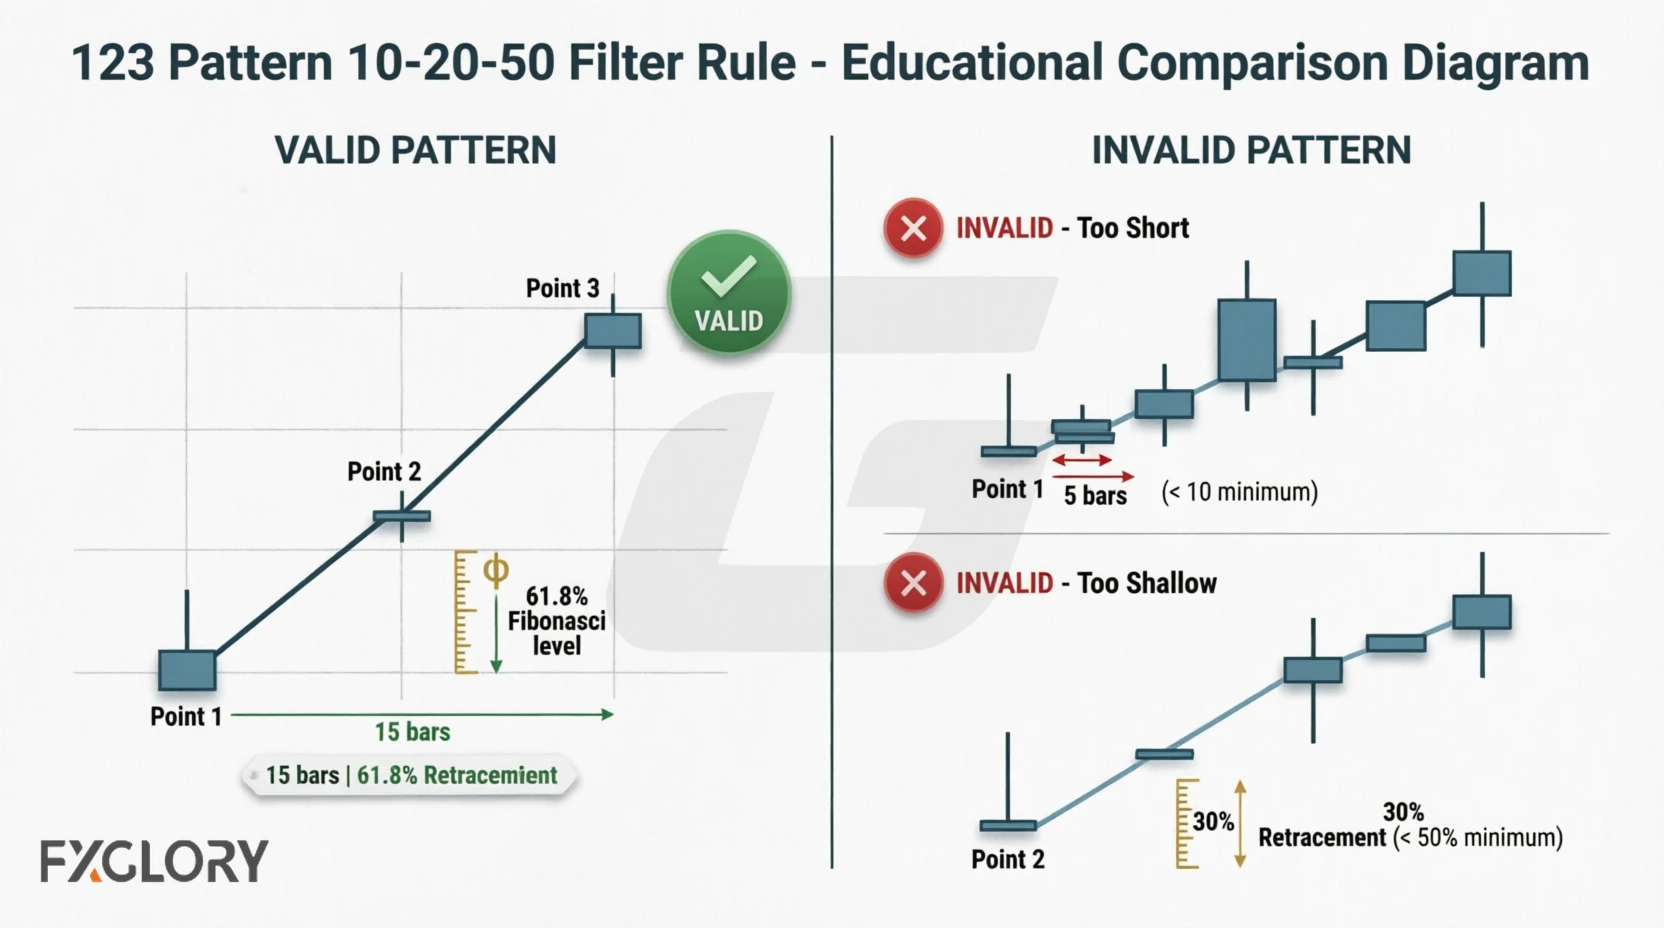
Several entry styles are associated with 123 structures, but they should not be treated as equally validated by the backtest on this page.
1. Point 2 Breakout
The reported test used a daily close above Point 2 for a bullish setup. This is the entry rule that corresponds directly to the backtest results. It is a conditional breakout because the Point 1-2-3 structure must already exist.
2. Trendline Break Entry
Some traders draw a line across the developing swing structure and enter before Point 2 is broken. This produces earlier exposure but is a different rule set. The backtest reported here did not test this entry, so no comparative win-rate or risk claim is made for it.
3. Failed-Reversal Continuation
If the 123 reversal fails and price breaks the structure in the direction of the prior trend, that can be studied as a separate trend-continuation setup. It is not the reversal entry tested on this page and should be evaluated separately.
Take-Profit Methods: Geometric Projection, Fibonacci, and 2R
Target selection changes the behavior of any 123 strategy, so it is important to separate chart-based projection methods from the target rule actually used in the backtest.
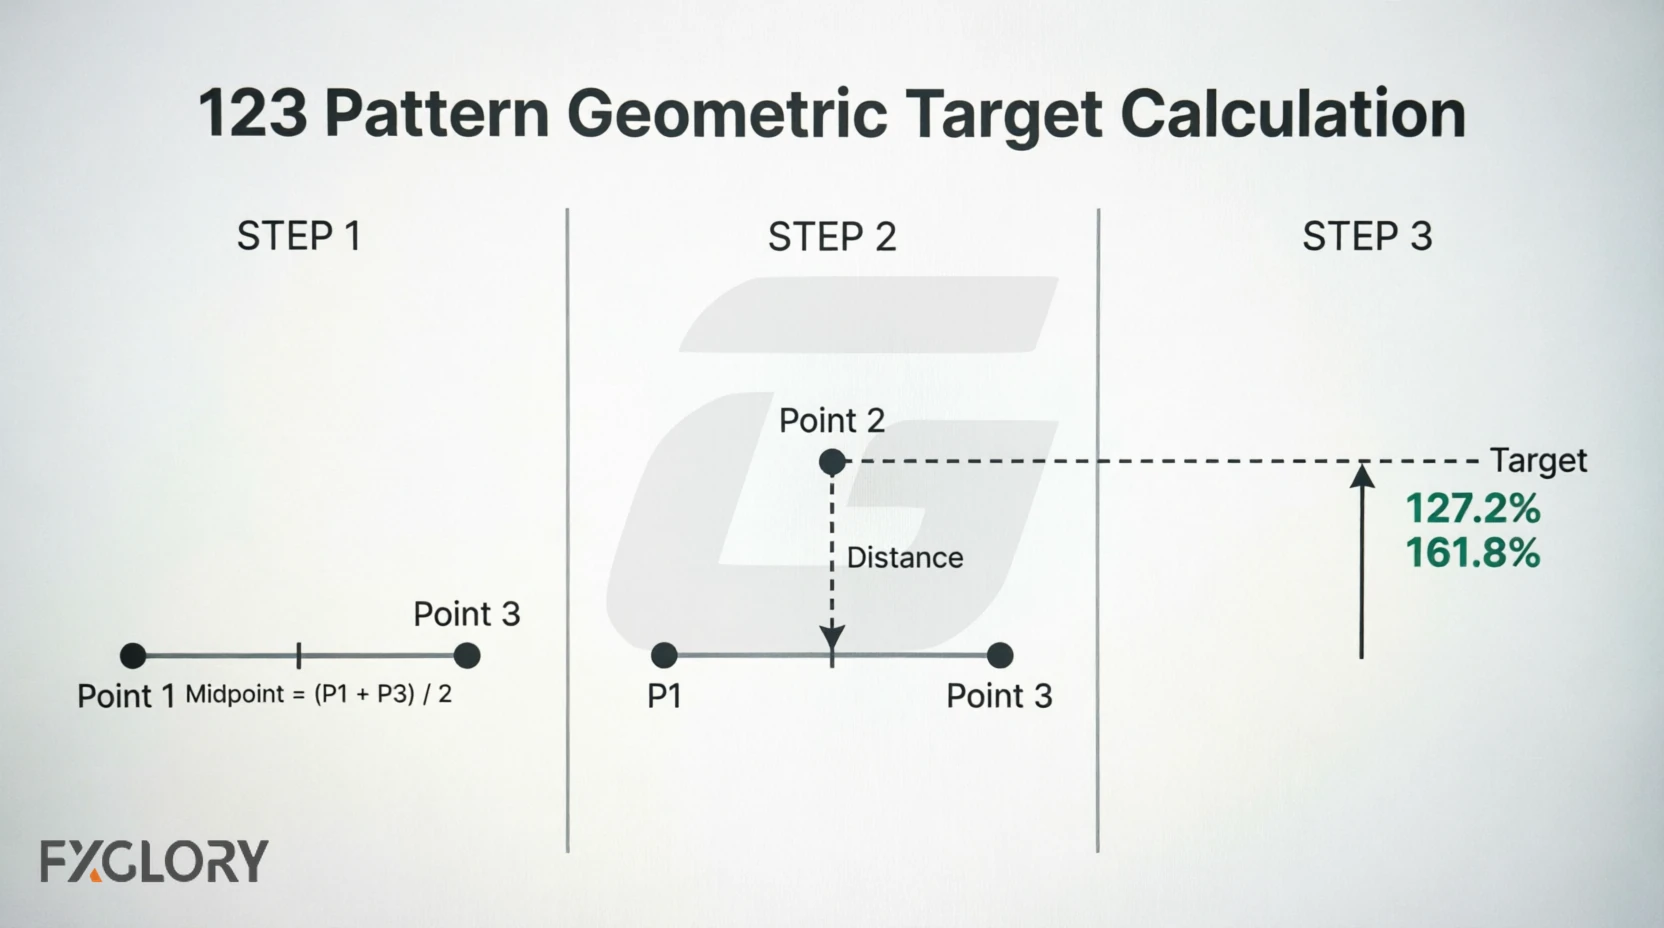
The Geometric Midpoint Projection
- Identify the price levels of Point 1 and Point 3.
- Calculate their midpoint: Midpoint = (Point 1 + Point 3) / 2.
- Measure the distance from Point 2 to that midpoint.
- Project the same distance beyond Point 2 as a chart-based target.
Fibonacci Extensions
Fibonacci extensions such as 127.2% or 161.8% are another optional way to map projected price levels. They should be tested as separate exit rules rather than assumed to improve results.
The Target Used in This Backtest
The historical model used a fixed 2R target based on entry-to-stop distance, not the geometric midpoint projection or Fibonacci extensions. The average realized win was +0.922R because trades could also be closed by the 60-bar maximum holding rule and were affected by modeled costs and exit timing.
Stop-Loss Placement and Structural Invalidation
For a bullish 123 reversal, Point 3 is a natural structural invalidation reference because a decisive break below it weakens the higher-low premise. The precise stop distance beyond Point 3 should not be treated as a universal fixed number of pips.
The historical model used a stop beyond Point 3 with a fixed 5-pip buffer plus modeled spread. That value exists to define the test consistently; it does not prove that five pips is optimal, nor that a fixed buffer prevents stop-outs. A volatility-based or instrument-specific stop could behave differently and would require separate testing.
In practice, determine the structural stop level first, calculate the resulting stop distance second, and then size the position from the chosen account-risk limit. See the forex risk management strategy for the position-sizing relationship.
123 Pattern vs. Head & Shoulders, Double Bottoms, and ABCD
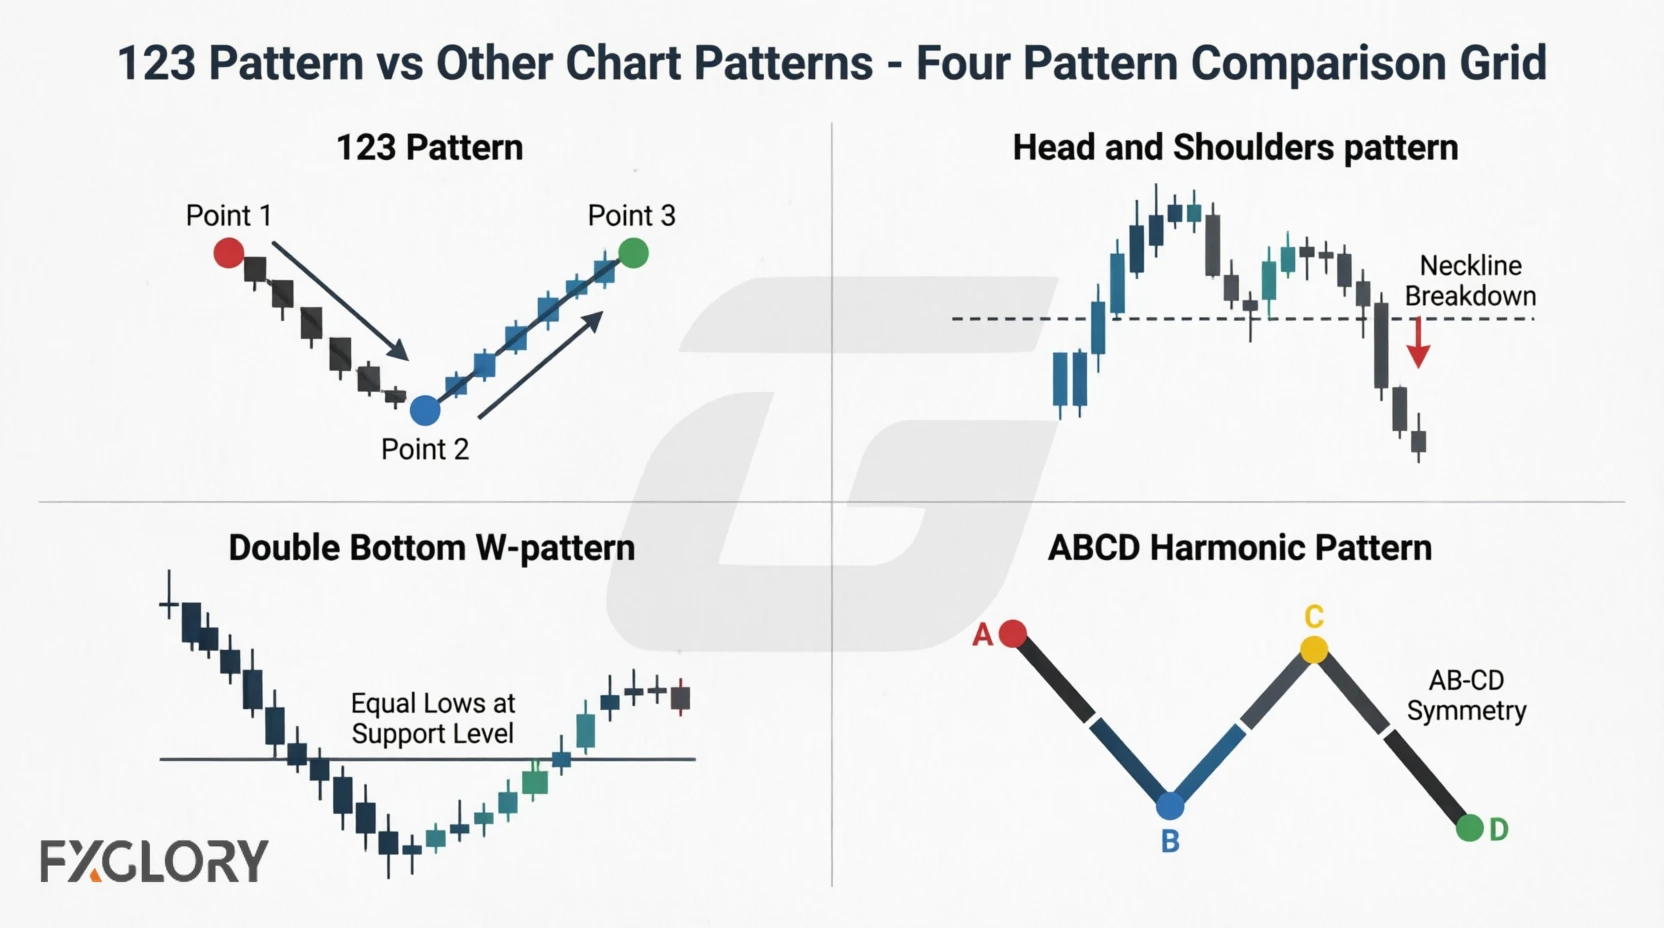
The 123 pattern can resemble other reversal or swing structures, but the identification rules differ.
| Pattern | Structural Requirement | Typical Trigger | Key Difference |
|---|---|---|---|
| 123 Pattern | Three swings: initial extreme, reaction, failed retest. | Break of Point 2. | Point 3 fails to exceed Point 1 in the direction of the prior move. |
| Head & Shoulders | Left shoulder, head, right shoulder. | Break of the neckline. | Uses a three-peak or three-trough formation and neckline rather than numbered swing logic. |
| Double Bottom | Two lows around a similar area. | Break of the intervening swing high. | The second low is usually near the first; a bullish 123 specifically requires Point 3 to remain above Point 1. |
| ABCD Pattern | Four points forming two impulse legs separated by a retracement. | Completion of the projected CD leg. | Focuses on proportionality between legs rather than a failed retest and Point 2 breakout. |
No-Trade Conditions for the 123 Setup
Instead of repeating the backtest's eligibility thresholds here, use this section for conditions that invalidate or materially change the setup:
- Point 3 breaks Point 1: the reversal structure is no longer valid under this definition.
- The breakout is not confirmed: if the chosen rule requires a close beyond Point 2, an intrabar touch alone does not satisfy it.
- Execution conditions are abnormal: unusually wide spreads, fast news-driven movement, or poor liquidity can make a predefined stop and target behave differently from a historical daily-bar test.
- The required stop distance is incompatible with the risk plan: reduce position size or stand aside rather than forcing a fixed position size.
Backtesting the 123 Pattern with Fractal Logic
Manual swing identification can introduce hindsight bias, so the historical model defined the pattern programmatically:
- Point 1 = a 5-bar fractal low.
- Point 2 = the next 5-bar fractal high.
- Point 3 = the next 5-bar fractal low, with Point 3 above Point 1.
- Point 1-to-Point 3 distance = 10-30 bars.
- Point 2 retracement condition = at least 50%.
- Entry = daily close above Point 2.
- Stop = beyond Point 3 using the model's fixed 5-pip buffer plus modeled spread.
- Target = fixed 2R.
- Maximum holding period = 60 daily bars.
Educational Backtest: 123 Pattern Across Six Pairs (2014–2024)
The following results were generated from yfinance public research data using the rules above. The source was research data rather than FXGlory broker execution data.
Combined Metrics — All Pairs, All Sensitivity Runs
| Metric | 123 Pattern Model |
|---|---|
| Trades (all sensitivity runs) | 1,512 |
| Win rate | 31.88% |
| Average win | +0.92R |
| Average loss | -0.81R |
| Expectancy | -0.258R |
| Profit factor | 0.53 |
| Max drawdown | -397.95R |
| Worst losing streak | 19 trades |
| Avg holding period | 35.96 days |
Pair-Level Comparison
| Pair | Trades | Win Rate | Expectancy | Profit Factor |
|---|---|---|---|---|
| EURUSD | 288 | 22.57% | -0.549R | 0.20 |
| GBPUSD | 207 | 21.74% | -0.564R | 0.20 |
| USDJPY | 171 | 63.16% | +0.268R | 2.39 |
| AUDUSD | 288 | 22.92% | -0.382R | 0.40 |
| USDCAD | 261 | 44.83% | +0.069R | 1.21 |
| USDCHF | 297 | 27.27% | -0.235R | 0.63 |
Combined performance was negative. The model's 31.88% win rate was accompanied by -0.258R expectancy and a 0.53 profit factor. Those figures are more informative than win rate alone because they incorporate the relative size of winning and losing outcomes.
Pair-level variation was large. USDJPY and USDCAD were positive in this test, while four pairs were negative. This shows sensitivity to the tested market sample, not a guaranteed pair-selection rule.
Holding time was long. The average trade remained open for 35.96 days. Because broker-specific swap and rollover were excluded, the test cannot quantify their effect on the reported results.
The fixed 2R target was not always realized. Average winning trades finished at +0.922R. The 60-bar maximum holding rule and modeled trading costs can close or reduce outcomes before the fixed target is reached.
The stop buffer was not independently validated. Average loss was -0.811R, but the test did not compare the 5-pip buffer with no buffer or with volatility-based alternatives. It therefore cannot show that the buffer improved performance.