

ETHUSD Forecast

ETH/USD Live Price

2525.92000
+2.69%

ETH/USD Forecast — 12 September 2026

Time Zone: GMT +3

Time Frame: Daily (D1) / Weekly Outlook

Weekly Fundamental Overview:

ETH/USD market dynamics remain sensitive to global liquidity conditions and overall risk appetite. Macroeconomic announcements from the United States, particularly central bank rate decisions and consumer spending data, frequently influence broader market sentiment, impacting crypto valuations including ETHUSD. Traders closely monitor upcoming monetary policy updates and economic indicators for directional cues.

Price Action:

The ETH/USD pair recently closed at 2458.84, demonstrating sustained buying interest after building momentum from lower levels. The daily chart reflects a series of higher closes, pushing price action toward local peak levels as buyers test overhead supply. Current price structure indicates a strong consolidation near key resistance areas.

Key Technical Indicators:

Bollinger Bands: The Bollinger Bands display a middle band at 2355.11, an upper band at 2762.23, and a lower band at 1947.99. ETH/USD is trading near 2458.84, holding above the middle band, which indicates a positive trend orientation within the expanded envelope.

RSI: The 14-day Relative Strength Index (RSI) stands at 64.90. Operating above the neutral 50 level without crossing into overbought territory above 70, the indicator suggests ongoing bullish strength with potential room for further price exploration.

MACD: The MACD indicator prints a reading of 131.86, remaining well above the zero line. This positive value highlights active bullish momentum across daily timeframes, reflecting persistent upward pressure on ETHUSD.

Support and Resistance:

Key technical levels for ETH/USD include immediate resistance at 2564.28 and broader major support at 1508.09. A sustained breach above resistance could clear the way toward upper band targets, while failure to hold gains may lead back toward intermediate support levels.

News to Watch for ETHUSD This Week:

  • Core Retail Sales m/m: Shifts in core consumer purchasing patterns offer insight into broader US economic strength that impacts market risk sentiment.
  • Retail Sales m/m: Overall consumer spending figures provide key indications of economic activity that can influence asset valuations.
  • FOMC Economic Projections: Updated macroeconomic forecasts present the central bank outlook on inflation and growth, affecting financial markets.
  • FOMC Statement: Official policy communications outline the monetary stance and liquidity conditions driving global asset prices.
  • Federal Funds Rate: Official benchmark rate decisions directly influence borrowing costs, liquidity, and general market risk appetite.
  • FOMC Press Conference: Detailed commentary from Fed leadership provides crucial context regarding future policy paths and market volatility.
  • Unemployment Claims: Weekly labor market updates offer timely snapshots of economic stability and investor sentiment.

Weekly Outlook and Consideration:

ETH/USD enters the week with a positive bias after closing at 2458.84. Technical indicators support buyer control, with the RSI at 64.90 and MACD at 131.86 signaling steady momentum above the middle Bollinger Band at 2355.11. The primary challenge for bulls lies at the immediate resistance level of 2564.28. A clear breakout above this threshold could see price action test the upper Bollinger Band at 2762.23. Conversely, if resistance holds firm, a corrective phase toward middle support at 2355.11 or lower could unfold, especially in response to upcoming high-tier US macroeconomic releases. Major long-term structural support remains anchored at 1508.09.

Disclaimer: The analysis provided for ETH/USD is for informational purposes only and does not constitute investment advice. Traders are encouraged to perform their own analysis and research before making any trading decisions. Market conditions can change quickly, so staying informed with the latest data is essential.
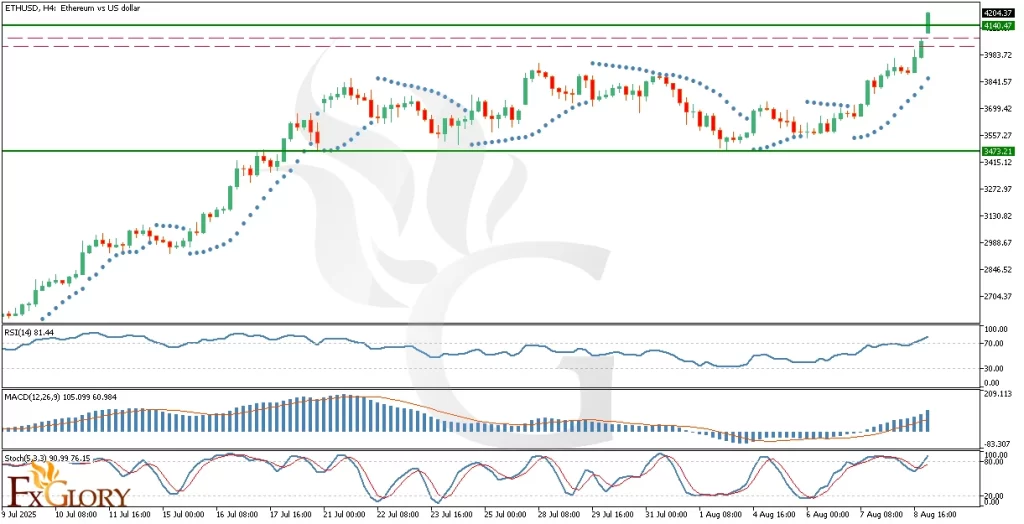
ETH/USD D1 technical analysis chart
ETH/USD D1 Technical Analysis for 09.12.2026

ETH/USD Forecast — 5 September 2026

Time Zone: GMT +3

Time Frame: Daily (D1) / Weekly Outlook

Weekly Fundamental Overview:

The fundamental environment for ETH/USD remains closely tied to broader macroeconomic trends, US interest rate expectations, and overall risk sentiment. Market participants are monitoring incoming economic data from the United States to assess liquidity conditions, which frequently influence valuation in the cryptocurrency sector. A shifting macroeconomic landscape could drive heightened volatility across risk-sensitive instruments like ETHUSD.

Price Action:

On the daily D1 chart, ETH/USD has demonstrated an upward drive, rising from recent lows around the 1800-1900 region to reach a last close of 2503.15. Recent daily candles display consistent bullish momentum, pushing price action toward key overhead resistance while establishing a sequence of higher highs and higher lows over recent sessions.

Key Technical Indicators:

Bollinger Bands: The daily Bollinger Bands highlight an expanding volatility structure. The middle band sits at 2209.11, providing dynamic intermediate support, while the upper band is located at 2744.84 and the lower band rests at 1673.38. ETH/USD trading near 2503.15 indicates strong relative strength as price action remains positioned in the upper band channel.

RSI: The 14-day Relative Strength Index (RSI) stands at 71.40, crossing above the standard 70 threshold. While this underscores robust buying momentum in ETH/USD, it also highlights overbought conditions on the daily timeframe, pointing to the risk of temporary consolidation or a minor pullback.

MACD: The D1 MACD indicator shows strong positive momentum, currently reading at 156.44. The indicator remains above its baseline, signaling active bullish momentum in ETHUSD, though traders continue to monitor for potential signs of momentum divergence.

Support and Resistance:

Key daily technical levels for ETH/USD show primary support around 1508.09 and key resistance near 2564.28. A sustained push above current resistance levels could open the door for further tests toward upper technical boundaries, whereas failure to breach resistance may lead to a retest of lower support zones.

News to Watch for ETHUSD This Week:

  • PPI m/m: Measures changes in producer prices to gauge wholesale inflation pressures affecting overall market sentiment.
  • Core PPI m/m: Tracks underlying producer price movements excluding volatile components to assess monetary policy expectations.
  • Unemployment Claims: Provides weekly data on labor market conditions that influence US economic trajectory and investor risk appetite.
  • Core CPI m/m: Reflects consumer inflation trends without volatile items, serving as a pivotal signal for broad economic direction.
  • CPI y/y: Offers an annualized perspective on consumer inflation that heavily impacts risk asset valuations.
  • Core CPI y/y: Highlights core annual price changes that inform market outlooks on liquidity and monetary policy.
  • CPI m/m: Shows monthly consumer price adjustments that directly affect dollar strength and crypto market sentiment.
  • Prelim UoM Inflation Expectations: Gauges long-term consumer inflation projections that impact interest rate expectations.
  • Prelim UoM Consumer Sentiment: Assesses overall consumer economic confidence which can drive general risk preference.

Weekly Outlook and Consideration:

The weekly technical outlook for ETH/USD reflects a strong bullish bias, supported by an encouraging MACD reading of 156.44 and price action holding above the daily middle Bollinger band of 2209.11. With the current price close at 2503.15 approaching resistance at 2564.28, an RSI reading of 71.40 suggests overbought conditions that could prompt temporary hesitation or corrective movement. Incoming US inflation releases will likely serve as key catalysts determining whether ETHUSD can breach current resistance or enter a phase of consolidation.

Disclaimer: The analysis provided for ETH/USD is for informational purposes only and does not constitute investment advice. Traders are encouraged to perform their own analysis and research before making any trading decisions. Market conditions can change quickly, so staying informed with the latest data is essential.

ETH/USD D1 technical analysis chart
ETH/USD D1 Technical Analysis for 09.05.2026

ETH/USD Forecast — 29 August 2026

Time Zone: GMT +3

Time Frame: Daily (D1) / Weekly Outlook

Weekly Fundamental Overview:

Broad economic data releases and macroeconomic trends continue to influence market liquidity and appetite for risk assets like ETH/USD. Traded sentiment remains tied to upcoming U.S. economic updates, which can drive overall market volatility and currency movements.

Price Action:

The daily D1 chart for ETH/USD shows a strong upward expansion, advancing sharply from recent consolidation around 1870-1900 to a closing price of 2506.63. Price action remains bullish while testing levels near the recent high of 2564.28.

Key Technical Indicators:

Bollinger Bands: Bollinger Bands on the daily timeframe have widened significantly following the recent advance. ETH/USD is trading near the upper band of 2579.53, well above the middle baseline at 2069.41 and the lower band at 1559.28.

RSI: The 14-day Relative Strength Index (RSI) stands at 82.01, moving deep into overbought territory. While this underscores strong buying pressure, it also raises the possibility of price consolidation or a minor pullback.

MACD: The MACD indicator signals solid upside momentum, registering a positive reading of 163.82. The indicator reflects the rapid price surge seen across recent daily sessions.

Support and Resistance:

Key technical levels for ETH/USD show immediate resistance located at 2564.28, which marks the recent high. On the downside, primary technical support is identified at 1508.09.

News to Watch for ETHUSD This Week:

  • ISM Manufacturing PMI: Shifts in manufacturing activity can impact risk sentiment across financial markets.
  • JOLTS Job Openings: Labor demand metrics offer insight into economic strength and market risk tolerance.
  • ISM Manufacturing Prices: Inflationary pressures within manufacturing can influence broader monetary expectations.
  • ADP Non-Farm Employment Change: Private sector employment trends help gauge labor market direction.
  • ISM Services PMI: Performance in the service sector provides a snapshot of broader economic health.
  • Non-Farm Employment Change: Headline labor figures frequently spark volatility across risk-sensitive instruments.
  • Unemployment Rate: Changes in the jobless rate shape market expectations regarding economic stability.
  • Average Hourly Earnings m/m: Wage growth data impacts inflation forecasts and global market sentiment.

Weekly Outlook and Consideration:

ETH/USD exhibits strong bullish momentum on the daily chart, having pushed up to close at 2506.63. Technical indicators confirm robust upside momentum, with the MACD at 163.82 and price pushing near the upper Bollinger Band of 2579.53. However, with the RSI at 82.01 in overbought territory, traders should be mindful of potential volatility or corrective pullbacks around the 2564.28 resistance zone. Fundamental events and macroeconomic data releases throughout the week may further influence price action and risk sentiment.

Disclaimer: The analysis provided for ETH/USD is for informational purposes only and does not constitute investment advice. Traders are encouraged to perform their own analysis and research before making any trading decisions. Market conditions can change quickly, so staying informed with the latest data is essential.

ETH/USD D1 technical analysis chart
ETH/USD D1 Technical Analysis for 08.29.2026

ETH/USD Forecast — 22 August 2026

Time Zone: GMT +3

Time Frame: Daily (D1) / Weekly Outlook

Weekly Fundamental Overview:

ETH/USD (ETHUSD) remains sensitive to broader market liquidity conditions, investor risk appetite, and macroeconomic trends originating from the United States. Key economic data releases can influence shift in sentiment across traditional financial markets and digital asset markets alike.

Price Action:

On the daily (D1) chart, ETH/USD (ETHUSD) has demonstrated significant upward momentum, advancing from recent low consolidation zones to close at 2315.9. The recent price expansion pushed the pair toward a high near the resistance level at 2356.51.

Key Technical Indicators:

Bollinger Bands: The Bollinger Bands reflect high market volatility on the daily timeframe. With the middle band positioned at 1928.90, the upper band at 2159.93, and the lower band at 1697.86, ETH/USD is currently trading above the upper band at 2315.9, signaling strong short-term bullish momentum.

RSI: The 14-period Relative Strength Index (RSI) stands at 80.57. This places ETH/USD (ETHUSD) in overbought territory, pointing to intense buying pressure while also warning of potential short-term exhaustion or consolidation.

MACD: The MACD indicator is currently reading 68.67, residing well above the zero line. This positive value highlights sustained bullish momentum and ongoing buyer dominance in recent daily trading sessions.

Support and Resistance:

Technical analysis places immediate resistance for ETH/USD at 2356.51. On the downside, critical long-term support is identified at 1508.09, with additional technical reference zones located near the Bollinger middle band at 1928.90.

News to Watch for ETHUSD This Week:

  • CB Consumer Confidence: Shifts in consumer sentiment can impact overall market risk appetite and speculative demand.
  • Core PCE Price Index m/m: As a key inflation metric for monetary policy, this release can alter market liquidity expectations.
  • Prelim GDP q/q: Updated economic growth data provides insight into macroeconomic health and general market sentiment.
  • Prelim GDP Price Index q/q: Inflationary measures within GDP reports influence expectations around monetary policy and asset pricing.
  • Unemployment Claims: Weekly jobless numbers offer a real-time check on economic labor stability and risk appetite.
  • Prelim Benchmark Payrolls Revision: Major employment benchmark revisions can trigger broader market adjustments across risk assets.

Weekly Outlook and Consideration:

ETH/USD (ETHUSD) enters the week in a strong technical posture after reaching a close of 2315.9. However, with the RSI elevated at 80.57 and the price holding above the upper Bollinger Band of 2159.93, the pair faces overbought conditions that could lead to price consolidation or a pull-back. Key resistance at 2356.51 will remain a critical pivot, while incoming US macroeconomic data could significantly affect risk sentiment across the market.

Disclaimer: The analysis provided for ETH/USD is for informational purposes only and does not constitute investment advice. Traders are encouraged to perform their own analysis and research before making any trading decisions. Market conditions can change quickly, so staying informed with the latest data is essential.

ETH/USD D1 technical analysis chart
ETH/USD D1 Technical Analysis for 08.22.2026

ETH/USD Forecast — 15 August 2026

Time Zone: GMT +3

Time Frame: Daily (D1) / Weekly Outlook

Weekly Fundamental Overview:

ETH/USD market dynamics remain tied to general market risk sentiment and broader macroeconomic trends driven by incoming U.S. economic data. Major economic updates and central bank publications could influence market volatility, dollar momentum, and risk appetite across digital assets like ETHUSD.

Price Action:

On the daily (D1) chart, ETH/USD recorded a recent close at 1882.42. Price action shows trading within a defined range following recent fluctuations between high points near 1942.87 and lows near 1824.93, reflecting a period of consolidation.

Key Technical Indicators:

Bollinger Bands: ETH/USD is currently positioned near the middle Bollinger Band at 1891.24. The upper Bollinger Band is situated at 1943.41, while the lower Bollinger Band sits at 1839.06, pointing to a compressed volatility environment across daily sessions.

RSI: The 14-day RSI is currently at 52.29, positioning ETHUSD in neutral territory above the 50 mark. This indicates a balanced market without immediate overbought or oversold extremes.

MACD: The MACD indicator for ETH/USD currently stands at 18.04. This positive value reflects underlying bullish momentum, although traders continue to observe signal line movements for indications of potential momentum shifts.

Support and Resistance:

Key technical levels for ETH/USD highlight primary daily resistance at 2137.87 and main support at 1508.09.

News to Watch for ETHUSD This Week:

  • Prelim Benchmark Payrolls Revision: Revisions to historical labor data can alter expectations regarding broad economic strength and interest rate paths.
  • FOMC Meeting Minutes: Insights into central bank discussions provide clarity on future monetary policy direction and broad market liquidity.
  • Unemployment Claims: Weekly jobless data offers an updated view on labor market conditions that can influence risk appetite.
  • Philly Fed Manufacturing Index: Regional business conditions serve as a measure of economic health and inflationary pressures.
  • Flash Manufacturing PMI: Preliminary purchasing managers data offers early signals regarding broader economic growth trends.

Weekly Outlook and Consideration:

ETH/USD enters the week with neutral technical indicators, as price remains bounded near the middle Bollinger Band at 1891.24 and the RSI stands at 52.29. Main support at 1508.09 and upper resistance at 2137.87 mark the key boundaries for potential directional expansion. Market participants will monitor incoming economic reports closely, as shift in broader risk appetite could drive price tests toward upper or lower technical boundaries.

Disclaimer: The analysis provided for ETH/USD is for informational purposes only and does not constitute investment advice. Traders are encouraged to perform their own analysis and research before making any trading decisions. Market conditions can change quickly, so staying informed with the latest data is essential.

ETH/USD D1 technical analysis chart
ETH/USD D1 Technical Analysis for 08.15.2026
1ETH = –––USD –––%
ETHUSD
Loading chart...