AUD/CAD Weekly Forecast: 18–24 October 2026
Daily check — 21 October 2026: The latest completed D1 close was 0.98430 on 20 October 2026. It remains between the formal invalidation levels 0.96705 and 1.00334. The authored weekly thesis remains valid.
In brief
AUD/CAD has a neutral weekly bias: consecutive lower D1 closes and negative momentum lean lower, while the neutral daily trend state keeps the bearish H4 pressure from defining the full-week thesis.
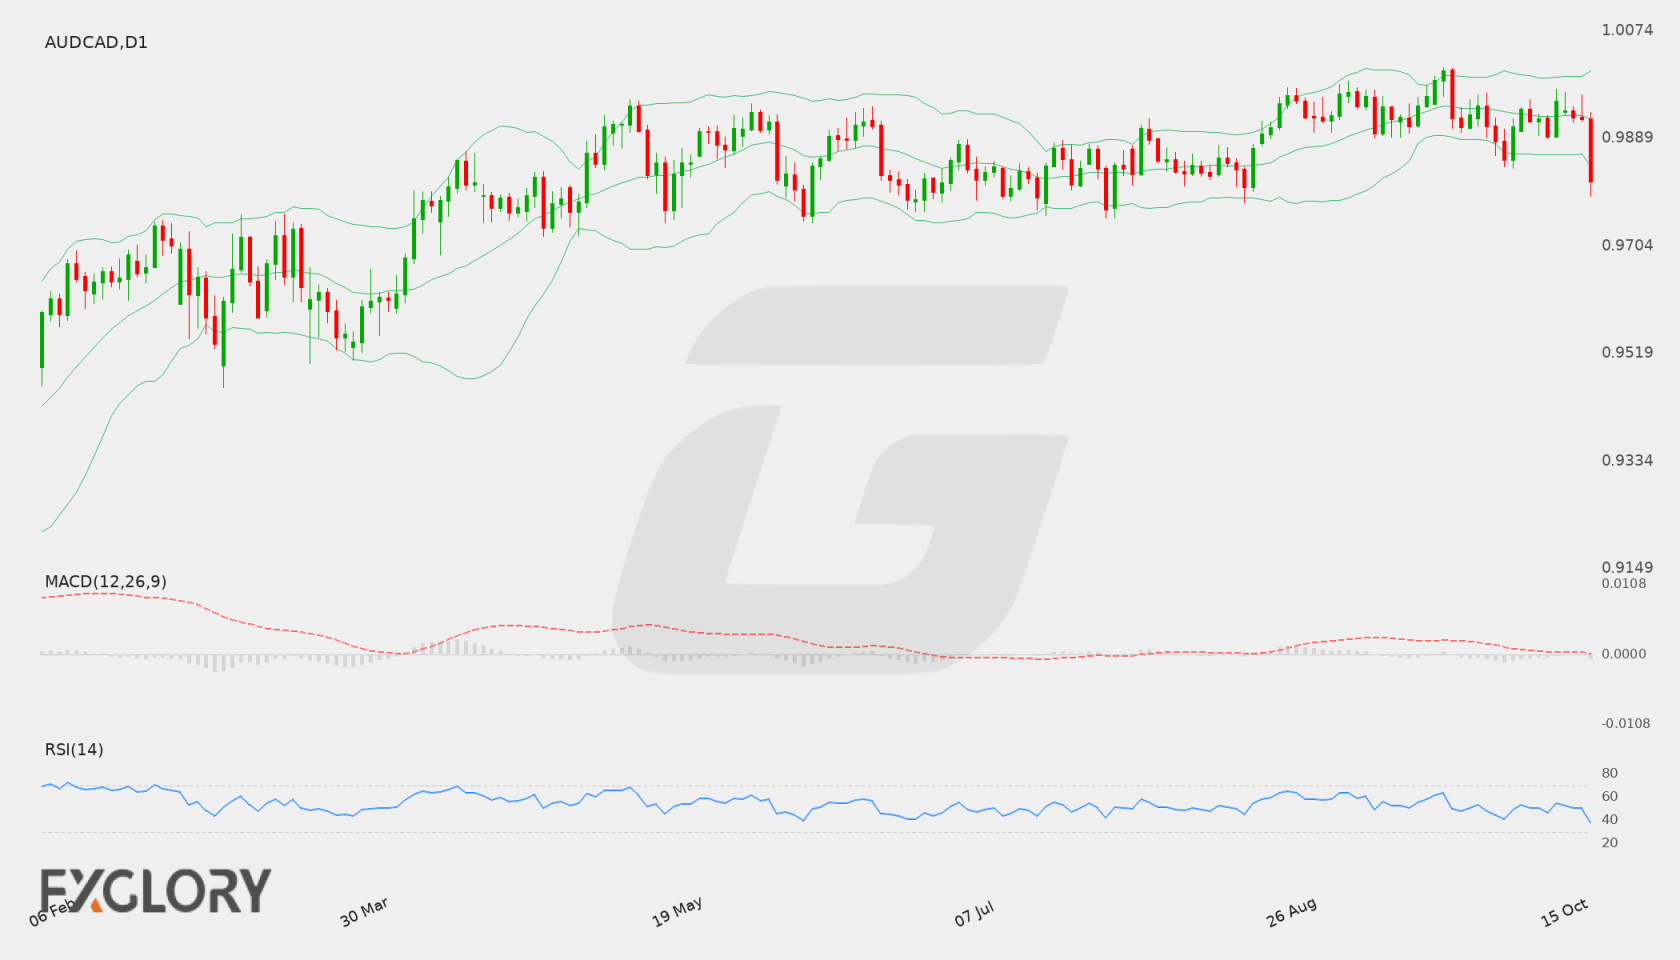
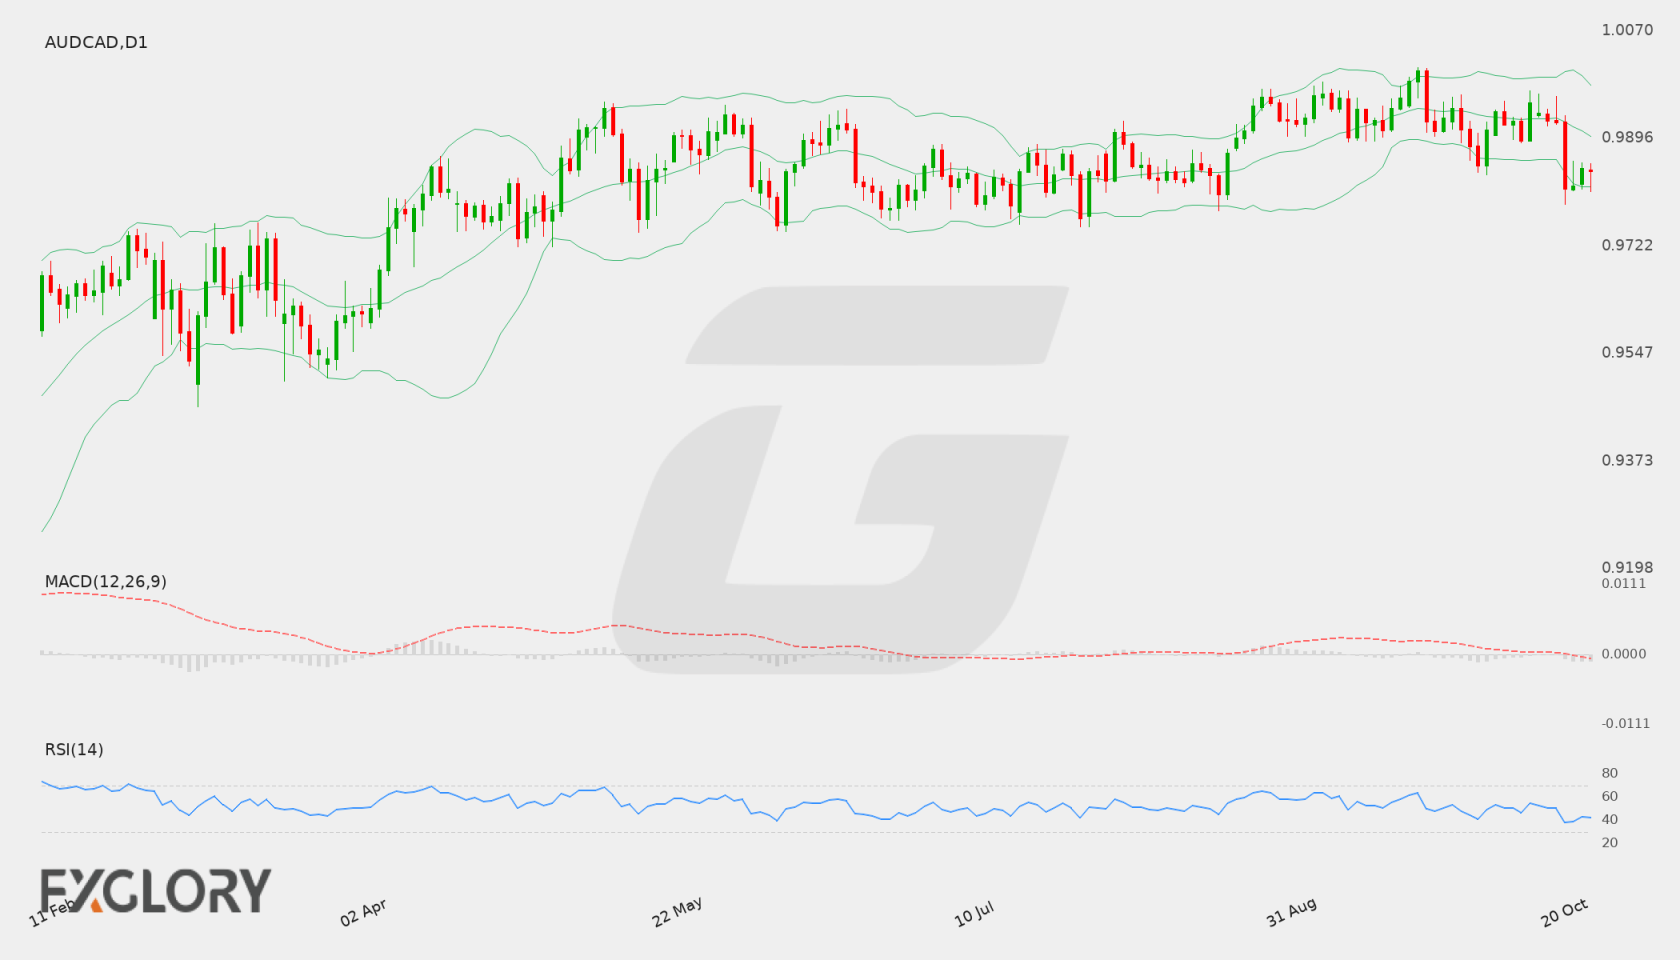
The D1 trend is classified as neutral, but the latest close of 0.98146 follows consecutive lower closes and sits below the 0.98396 lower Bollinger Band and the 0.99128 EMA20 and 0.99042 EMA50. RSI at 37.77 and a negative MACD histogram reinforce downside momentum, while price remains above the rising 0.97693 SMA200. This combination points to near-term weakness within a daily structure that has not been classified as a directional trend.
H4 is more decisively bearish: its close is below both moving averages, its RSI is 35.77 and its MACD histogram is negative. That alignment can keep pressure on the 0.97693 support, with 0.97207 the next supplied support if a completed daily move carries price lower. Expanding volatility and the CAD inflation releases add scope for faster level tests, but neither establishes direction; recovery above 0.98449 would be an early sign that the immediate downside pressure is easing.
Read full forecast: AUD/CAD Weekly Forecast: 18–24 October 2026