NZD/USD Forecast — 2 August 2026
Time Zone: GMT +4
Time Frame: 4 Hours (H4)
Fundamental Analysis:
No economic calendar events were provided for NZD/USD (NZDUSD). Price developments remain driven primarily by technical technical factors and prevailing market sentiment on the H4 chart.
Price Action:
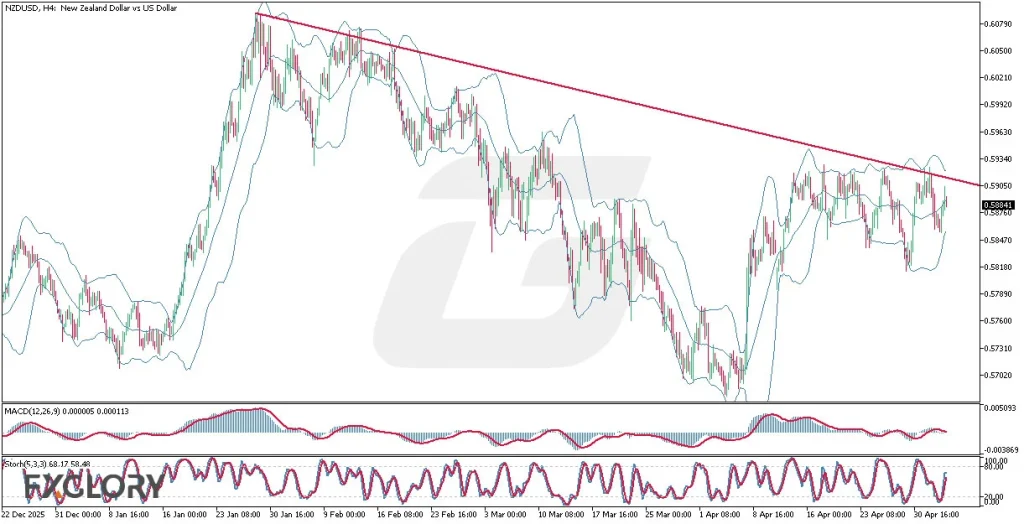
The H4 chart for NZD/USD shows a notable upward push, rising from recent lower levels near 0.5760 to close at 0.58765. The recent price action reflects persistent bullish pressure as buyers test higher levels near the 0.58865 region.
Key Technical Indicators:
Bollinger Bands(20,2.000): The Bollinger Bands on the H4 timeframe show a middle line at 0.58189, an upper band at 0.59026, and a lower band at 0.57353. NZD/USD trades elevated in the upper envelope at 0.58765, reflecting bullish volatility.
MACD(12,26,9): The MACD value stands at 0.00225, remaining in positive territory above the zero baseline, which aligns with recent upside price momentum in NZDUSD.
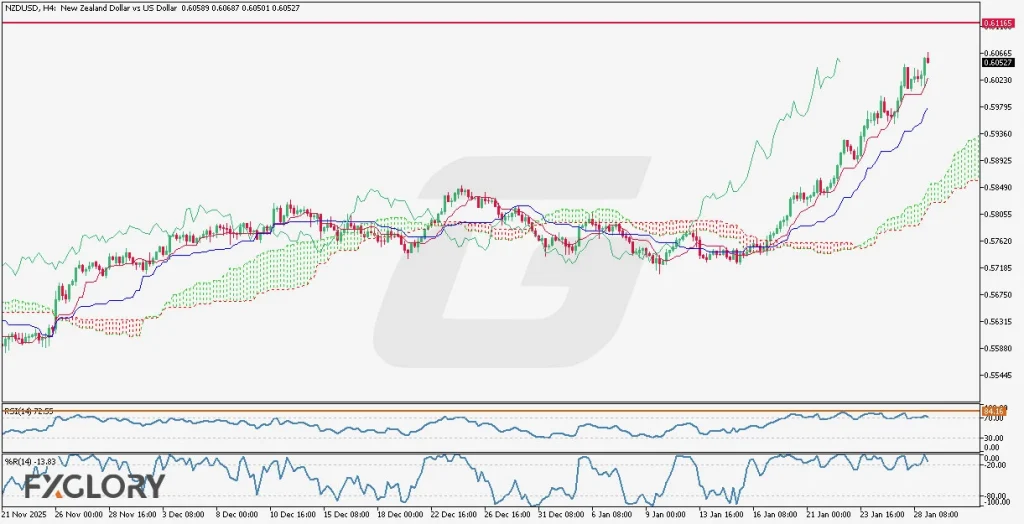
RSI(14): The 14-period RSI is registered at 65.88, signaling solid bullish momentum while remaining below overbought threshold levels.
Support and Resistance:
Key technical levels for NZDUSD include resistance at 0.58865 and primary support at 0.5760. The middle Bollinger Band at 0.58189 acts as a dynamic intermediate support level.
Conclusion and Consideration:
NZD/USD (NZDUSD) maintains an upward trajectory on the H4 chart, approaching resistance at 0.58865. A sustained move beyond this level could move price toward the upper Bollinger Band at 0.59026, whereas a retracement may find support near 0.58189 and 0.5760.
Disclaimer: The analysis provided for NZD/USD is for informational purposes only and does not constitute investment advice. Traders are encouraged to perform their own analysis and research before making any trading decisions. Market conditions can change quickly, so staying informed with the latest data is essential.