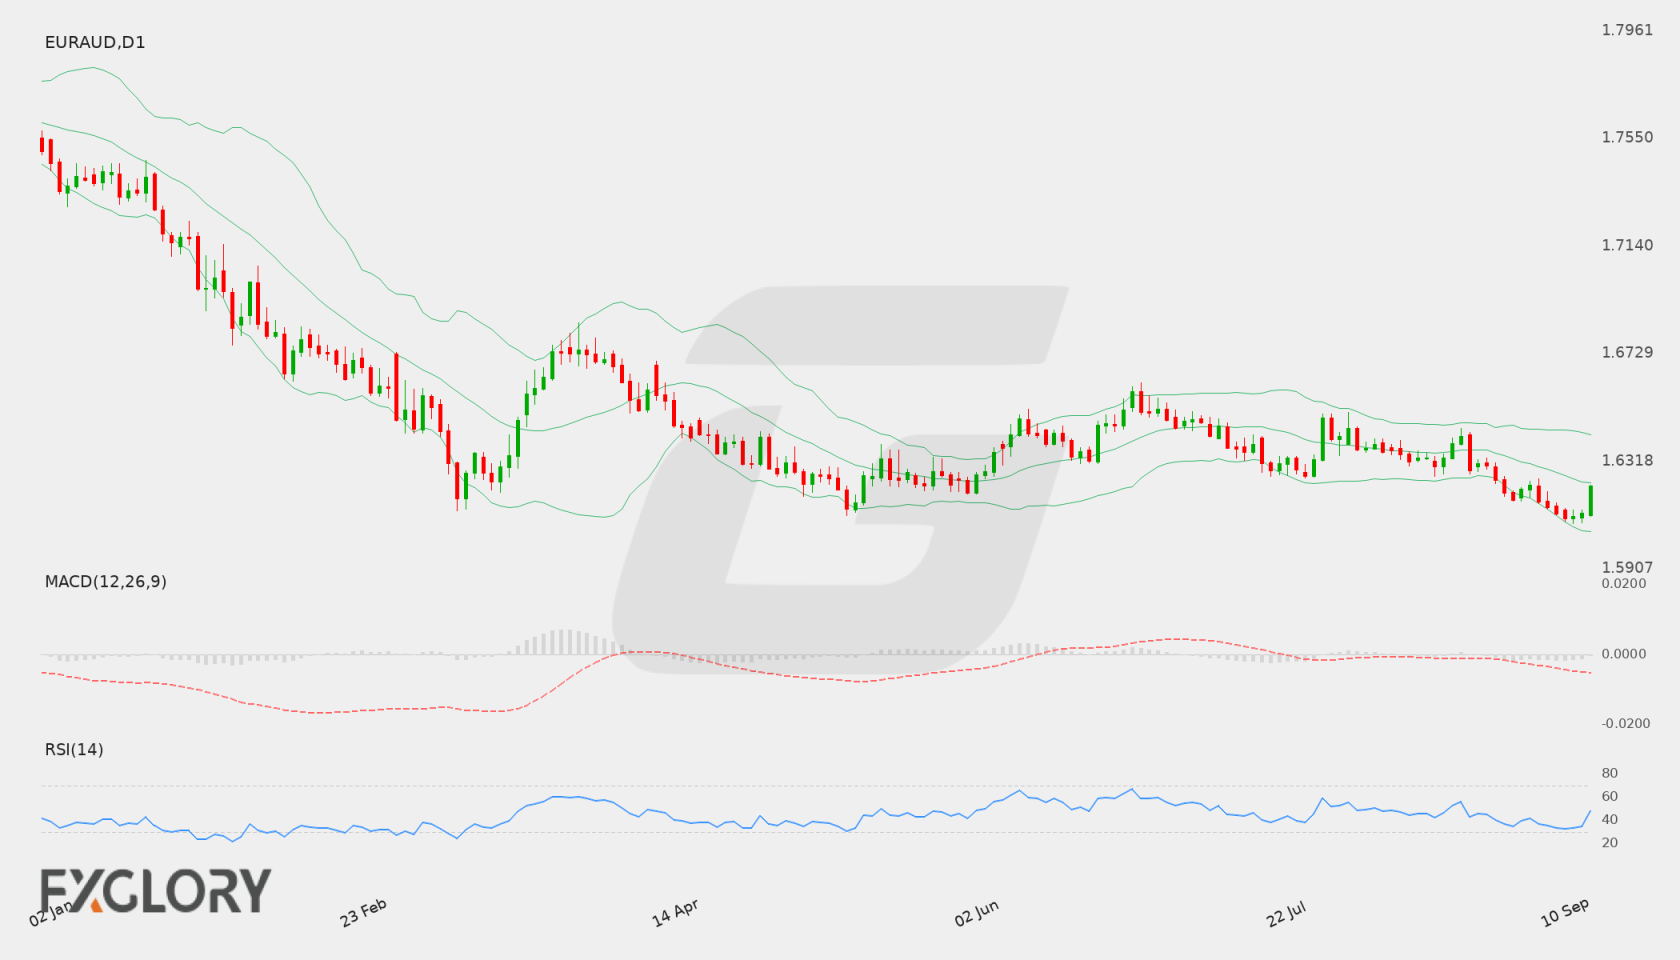
Current weekly forecast: This outlook covers 17–24 October 2026 and remains valid until 24 October 2026, unless its stated invalidation condition is triggered earlier.
Daily check — 21 October 2026: The latest completed D1 close was 1.60438 on 20 October 2026. It remains between the formal invalidation levels 1.59486 and 1.63280. The authored weekly thesis remains valid.
In brief
EURAUD has a neutral weekly outlook: mixed D1 structure and momentum are offset by bullish H4 conditions, leaving 1.61383 support and 1.63003 resistance as important reference levels.
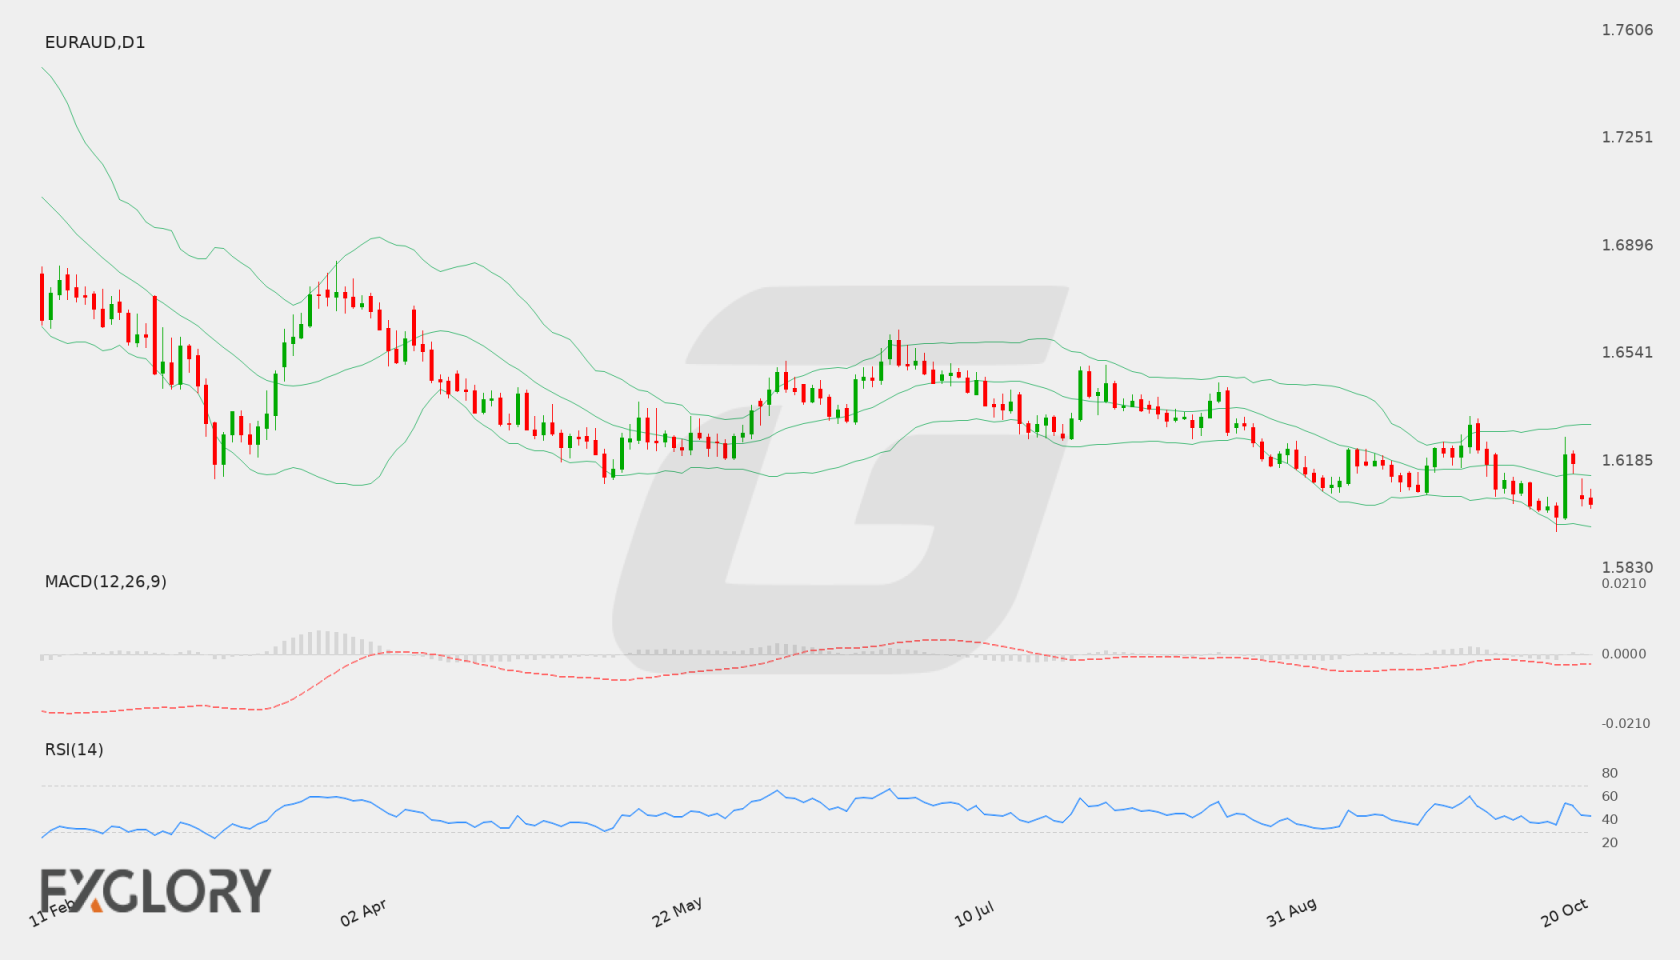
The D1 close at 1.62054 sits above the first listed support at 1.61383 and below the first listed resistance at 1.63003, with the close sequence classified as mixed. Neutral daily trend and momentum therefore offer no clear directional resolution, even though price is above the EMA20 and EMA50 and below the SMA200.
H4 readings are more constructive, with a bullish tactical state and positive MACD histogram, but that shorter-timeframe strength has not changed the neutral D1 assessment. The French and German flash PMI releases on 23 October may add event-related volatility to an already expanding-volatility environment; their outcomes and market effects are unknown.
EUR/AUD D1 technical-analysis context for the weekly forecast. Chart data captured 21 October 2026.
EURAUD has a neutral weekly outlook: mixed D1 structure and momentum are counterbalanced by bullish H4 conditions, with 1.61383 support and 1.63003 resistance framing the immediate range.
The D1 close at 1.62054 sits above the primary support at 1.61383 and below primary resistance at 1.63003. The daily trend and close sequence are neutral and mixed, while the falling EMA50 and SMA200 slopes temper the constructive position above the EMA20 and EMA50; momentum remains neutral rather than confirming a directional break.
H4 is bullish, with its close above the H4 EMA20 and EMA50 and positive MACD histogram, so tactical buying pressure is present. That strength has not yet established a D1 direction. Expanding volatility and the EUR and AUD events scheduled during the week could bring faster tests of the existing levels, without determining which side gives way.
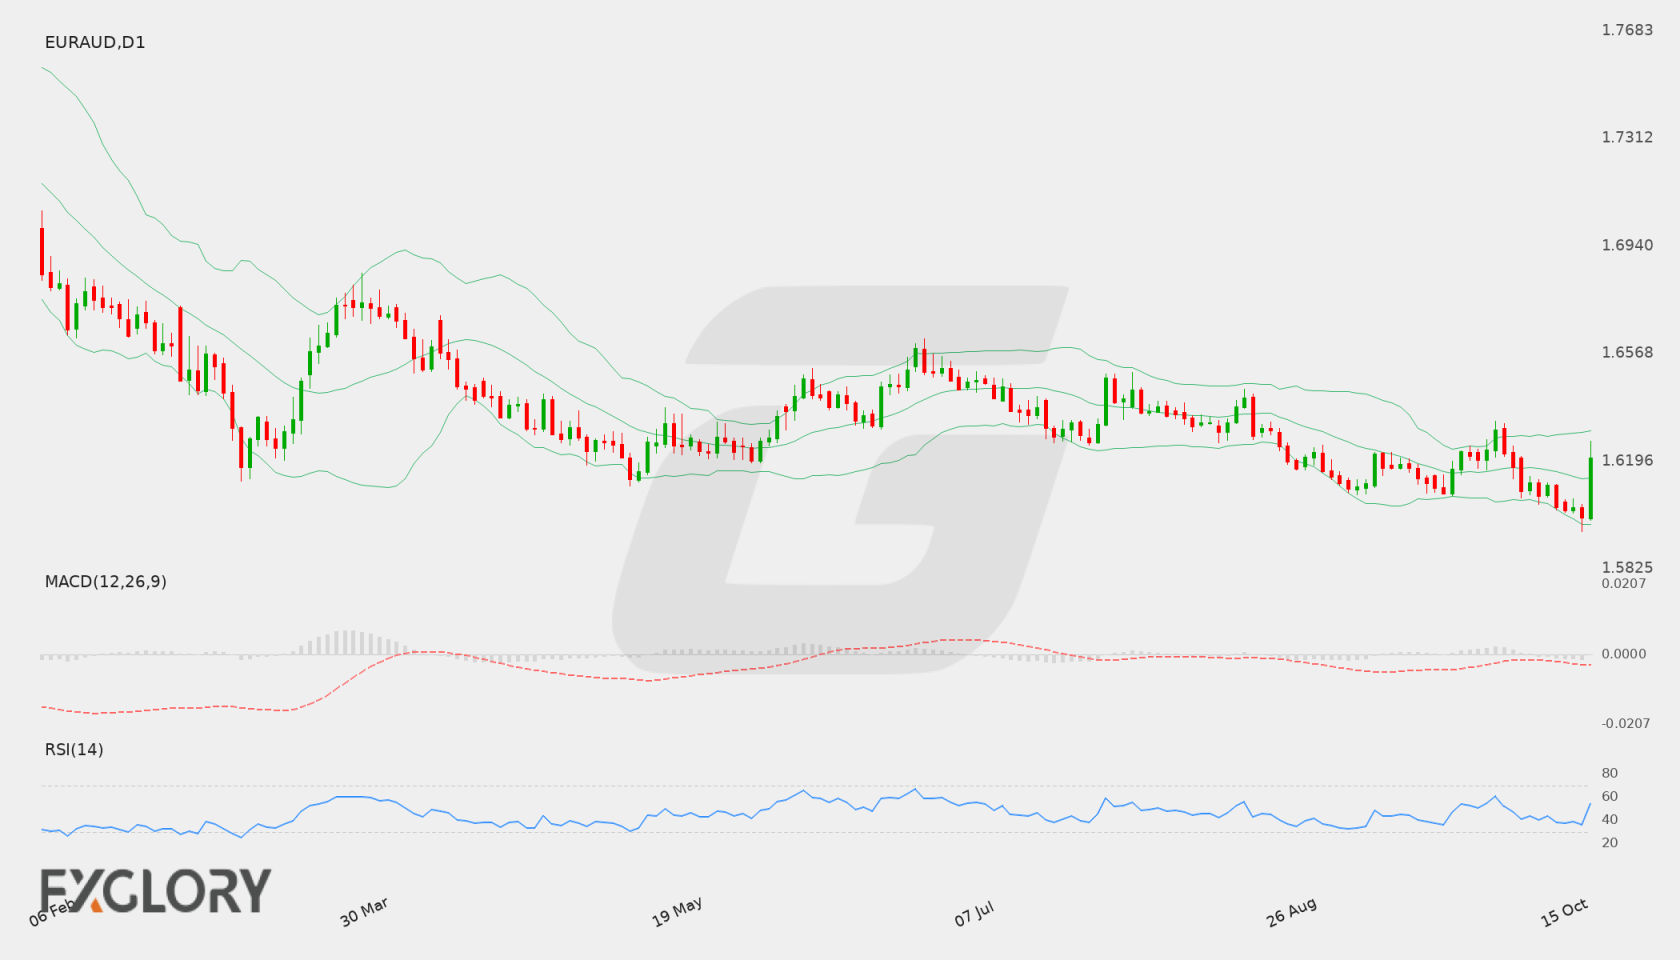
EUR/AUD D1 technical-analysis context for the weekly forecast. Chart data captured 16 October 2026.
EUR/AUD dynamics are shaped by economic developments across the Eurozone and Australia. Market attention centers on Australian labor indicators, where shifts in employment and joblessness can guide expectations regarding Reserve Bank of Australia monetary policy and relative currency valuation.
Price Action:
On the daily chart, EUR/AUD recorded a last close of 1.62232 after testing a session high of 1.63257 and a low of 1.62106. This follows recent upward movement from the 1.60740 support area toward the 1.63000 zone, reflecting consolidation within its broader range.
Key Technical Indicators:
Bollinger Bands: The Bollinger Bands on the D1 timeframe show a middle band at 1.61691, an upper band at 1.62818, and a lower band at 1.60565. With the latest close at 1.62232, EUR/AUD is positioned between the middle and upper bands, keeping the pair in the upper half of the recent standard deviation channel.
RSI: The 14-day Relative Strength Index (RSI) registers at 51.56. Positioned just above the neutral 50 mark, the metric reflects balanced market sentiment without signaling overbought or oversold conditions.
MACD: The Daily MACD sits at -0.000189, hovering right at the zero line. This marginal reading reflects subdued directional momentum, indicating that neither buyers nor sellers maintain control over the current trend.
Support and Resistance:
Key technical levels establish primary support at 1.60740, which marks the base of recent daily consolidation. To the upside, key resistance is positioned at 1.65027, representing the upper boundary on the daily timeframe.
News to Watch for EURAUD This Week:
Unemployment Rate: A shift in Australian joblessness may influence Reserve Bank of Australia monetary policy expectations and generate volatility in the Australian Dollar.
Employment Change: Variations in net employment provide insight into labor market momentum and can drive price adjustments in the pair.
Weekly Outlook and Consideration:
The weekly technical setup for EUR/AUD reflects a neutral-to-consolidating posture as price action settles at 1.62232. Operating between the Bollinger middle band at 1.61691 and upper band at 1.62818, the pair aligns with a neutral RSI of 51.56 and a flat MACD at -0.000189. Price continues to navigate the broader channel defined by support at 1.60740 and resistance at 1.65027. Macro focus rests on Australian Unemployment Rate and Employment Change releases, which may provide the impetus needed to test the outer technical boundaries.
Disclaimer: The analysis provided for EUR/AUD is for informational purposes only and does not constitute investment advice. Traders are encouraged to perform their own analysis and research before making any trading decisions. Market conditions can change quickly, so staying informed with the latest data is essential.
Trading in EUR/AUD is driven by monetary policy expectations from the European Central Bank and the Reserve Bank of Australia, alongside upcoming economic growth and inflation indicators. Broad risk sentiment and upcoming interest rate decisions also play a pivotal role in determining pair dynamics.
Price Action:
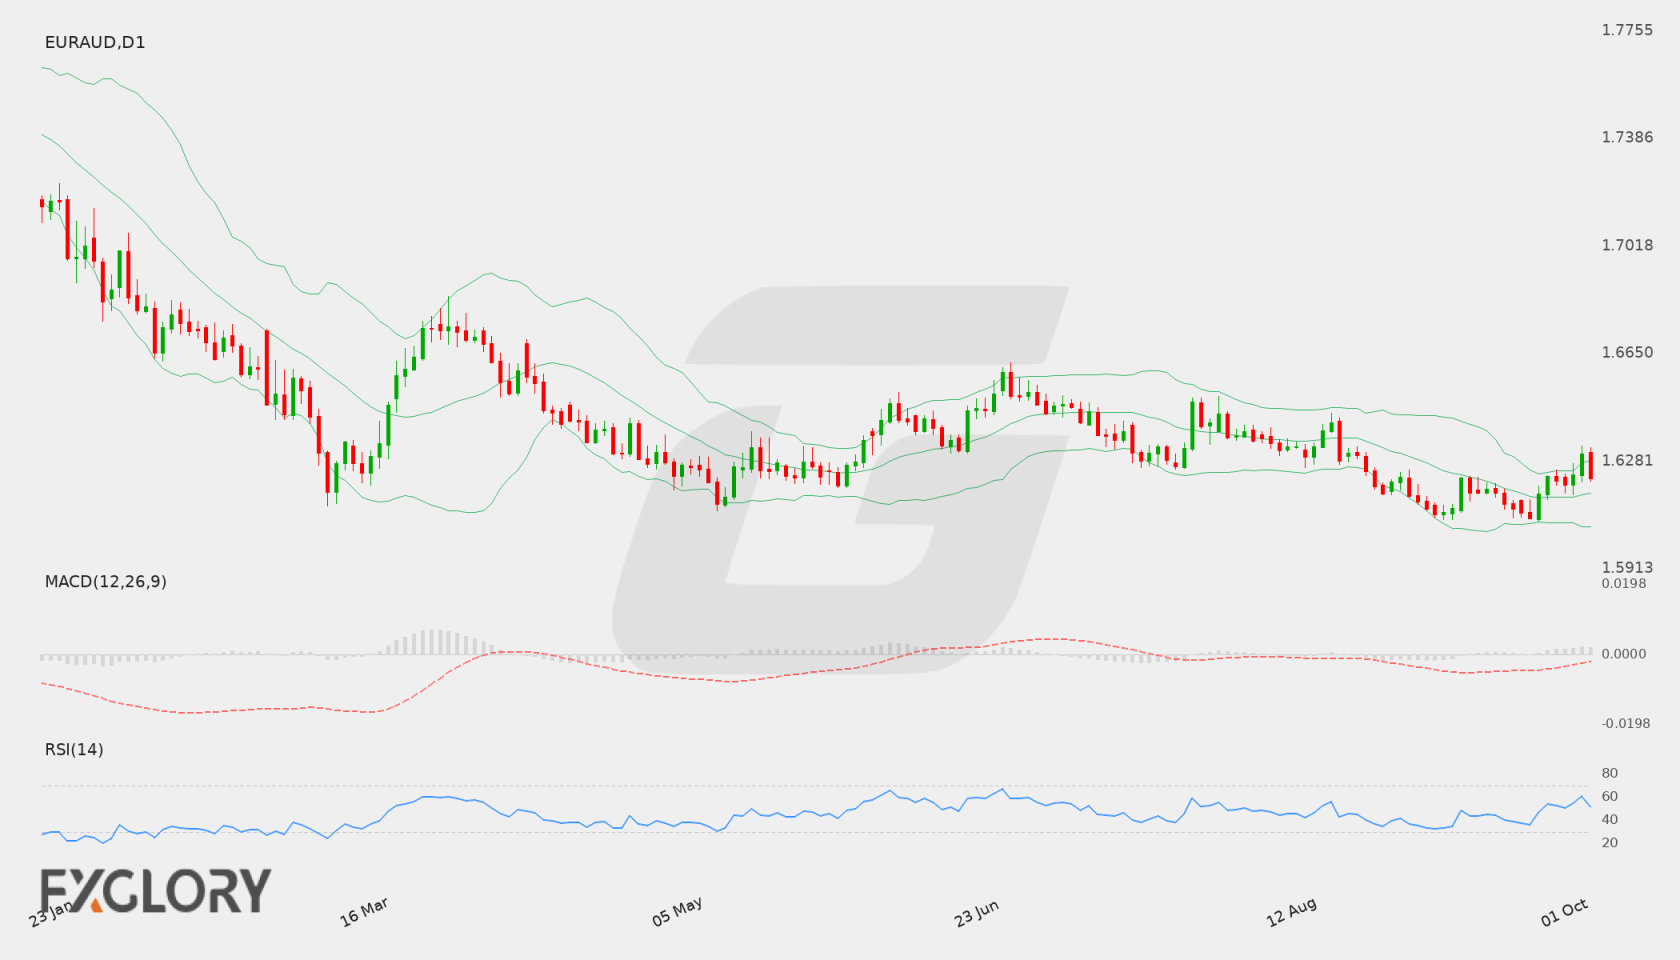
On the D1 timeframe, EUR/AUD recorded a recent close of 1.61362. Recent price candles reflect sustained downward movement, with price action remaining positioned below the 20-day middle Bollinger Band line.
Key Technical Indicators:
Bollinger Bands: The daily Bollinger Bands display a middle line at 1.61875, an upper band at 1.63088, and a lower band at 1.60663. With the current close at 1.61362 trading underneath the middle band, price rests in the lower half of the channel.
RSI: The 14-day Relative Strength Index (RSI) stands at 40.24. This placement below 50 reflects a moderate bearish inclination while remaining above the oversold threshold.
MACD: The daily MACD indicator reads -0.00424. Remaining below the zero mark, this value indicates ongoing downside momentum on the D1 chart.
Support and Resistance:
Technical analysis highlights key daily support at 1.60793, near the lower Bollinger Band of 1.60663. On the upside, main technical resistance is situated at 1.66172, with intermediate resistance near the middle Bollinger Band of 1.61875.
News to Watch for EURAUD This Week:
Cash Rate: The Reserve Bank of Australia's interest rate decision can significantly influence Australian dollar valuation.
RBA Rate Statement: Policy commentary from the central bank provides insight into economic assessments and potential rate adjustments.
RBA Press Conference: Speeches following the rate release often introduce volatility into Australian dollar pairs.
German Prelim CPI m/m: Inflation data from Germany offers an early look at regional price pressures affecting the euro zone.
CPI y/y: Year-over-year Australian inflation results help gauge overall price trends across the economy.
Trimmed Mean CPI m/m: Underlying inflation measures in Australia influence central bank policy outlooks.
CPI Flash Estimate y/y: Preliminary euro zone inflation data impacts European monetary policy expectations.
Core CPI Flash Estimate y/y: Underlying euro zone inflation metrics provide key signals regarding core price persistence.
Weekly Outlook and Consideration:
EUR/AUD maintains a soft D1 outlook following a close at 1.61362. Technical indicators mirror this posture, with the MACD sitting at -0.00424 and the RSI located at 40.24 beneath the middle Bollinger Band at 1.61875. Key levels to watch include support at 1.60793 and resistance at 1.66172, as high-impact economic releases and rate decisions dictate weekly price direction.
Disclaimer: The analysis provided for EUR/AUD is for informational purposes only and does not constitute investment advice. Traders are encouraged to perform their own analysis and research before making any trading decisions. Market conditions can change quickly, so staying informed with the latest data is essential.
The EUR/AUD currency pair reflects the interplay between European economic performance and the Australian labor and commodity landscape. Macroeconomic developments in France and Germany, particularly purchasing managers’ index releases, provide insight into Eurozone economic stability. Meanwhile, Australian employment data offers crucial cues regarding domestic economic health and labor market conditions. Traders monitor these key indicators to assess shifting monetary policy expectations from central banks. Broader risk sentiment also influences AUD performance, given its commodity-linked status against the Euro.
Price Action:
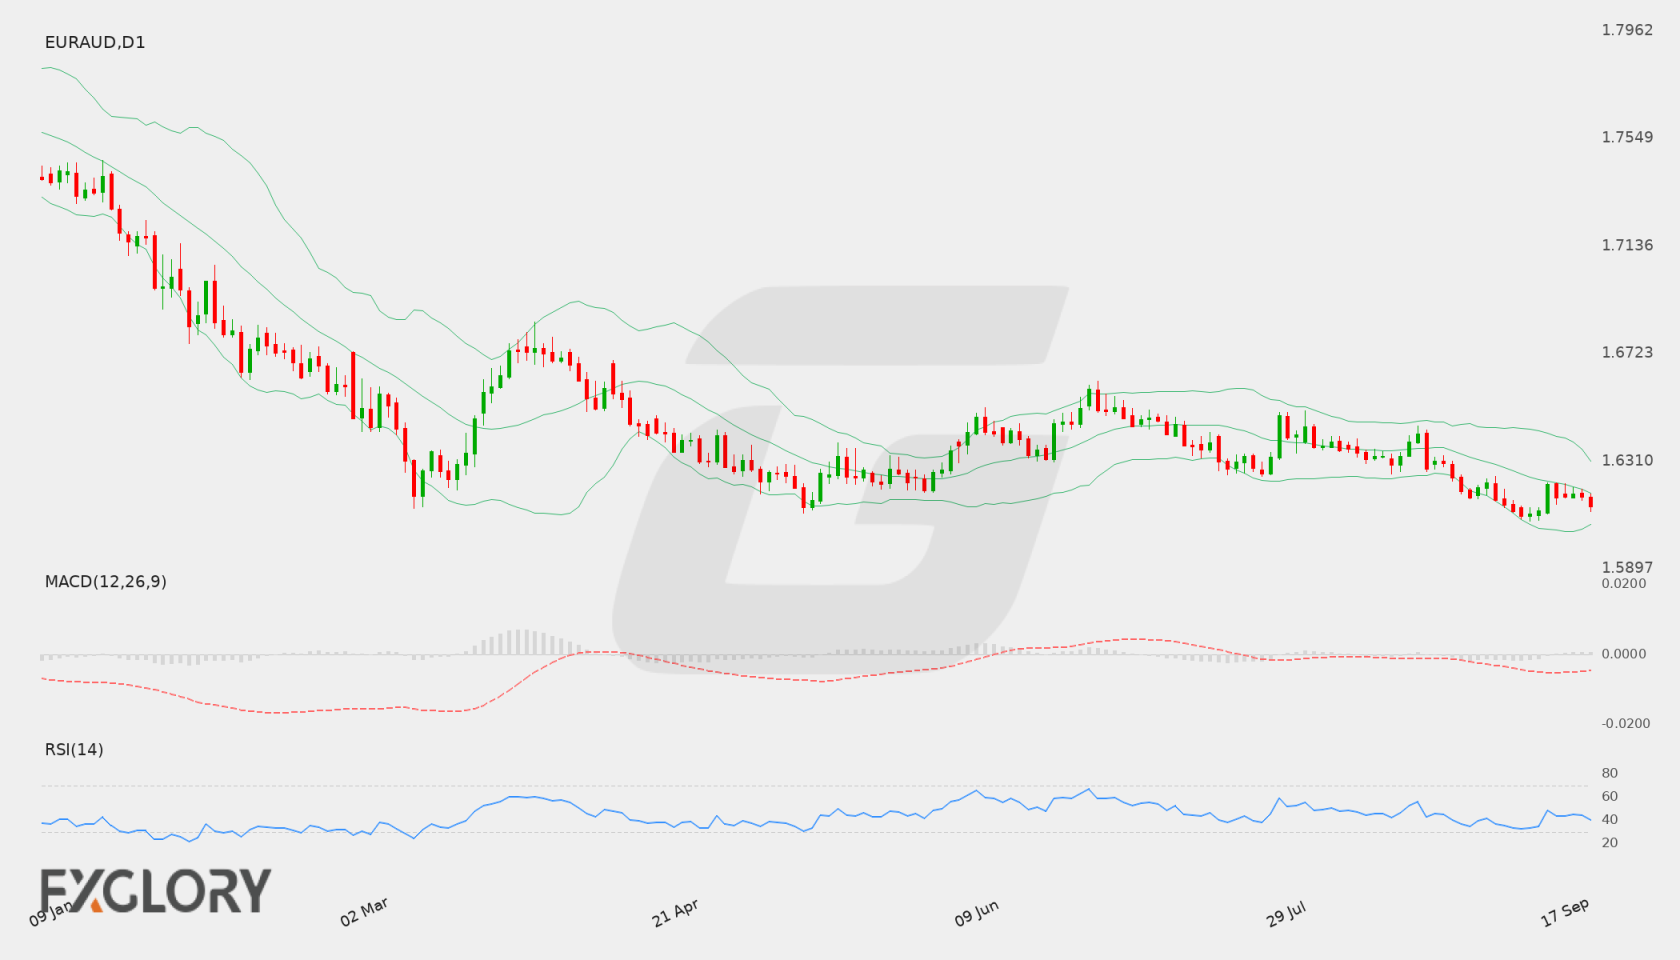
On the daily (D1) chart, EUR/AUD recorded a recent close at 1.62212 following a moderate rebound from recent lows near the 1.60793 region. The pair has experienced extended consolidation over recent sessions, floating close to its mid-range technical averages. Price action remains balanced between recent swing lows and overhead resistance, displaying limited directional conviction in the short term.
Key Technical Indicators:
Bollinger Bands: The daily Bollinger Bands highlight a neutral technical structure for EUR/AUD. The middle band sits at 1.62331, very close to the latest close of 1.62212, indicating a state of balance. The upper band is established at 1.64173, forming an initial dynamic resistance zone, while the lower band is located at 1.60489, offering potential dynamic support should downward pressures resume.
RSI: The 14-day Relative Strength Index (RSI) stands at 48.06. Positioned just below the neutral 50 threshold, the indicator reflects a balanced market without clear overbought or oversold extremes. This neutral reading reinforces the likelihood of continued short-term consolidation unless strong momentum emerges.
MACD: The MACD indicator on the D1 timeframe posts a value of -0.00562. Operating below the zero line, the reading points to sustained, mild bearish momentum underlying recent price behavior. However, the lack of aggressive downside expansion signals that seller control remains contained within broader range-bound conditions.
Support and Resistance:
Key daily technical levels for EUR/AUD highlight clear boundaries for price action. Main support is identified at 1.60793, reinforced by the lower Bollinger Band near 1.60489. On the upside, primary resistance is located at 1.66172, with intermediate resistance near the upper Bollinger Band at 1.64173.
News to Watch for EURAUD This Week:
French Flash Manufacturing PMI: Gauges manufacturing sector performance in France to provide early indications of Eurozone economic momentum.
French Flash Services PMI: Measures activity within the French services industry to evaluate regional service sector strength.
German Flash Manufacturing PMI: Tracks industrial health in Germany, offering critical insight into Eurozone economic trends.
Employment Change: Measures net job creation in Australia, directly influencing sentiment surrounding the Australian Dollar.
Weekly Outlook and Consideration:
The weekly outlook for EUR/AUD suggests a neutral-to-cautious trading environment as the pair consolidates near 1.62212. Technical indicators, including a neutral RSI at 48.06 and a slightly negative MACD of -0.00562, indicate limited directional momentum. If buyers gain traction above the 1.62331 middle Bollinger Band, price action may test upper resistance towards 1.64173 and eventually 1.66172. Conversely, a breakdown below immediate support at 1.60793 could open the path toward lower levels near 1.60489. Upcoming European PMI releases and Australian labor data will be vital catalysts for driving potential volatility.
Disclaimer: The analysis provided for EUR/AUD is for informational purposes only and does not constitute investment advice. Traders are encouraged to perform their own analysis and research before making any trading decisions. Market conditions can change quickly, so staying informed with the latest data is essential.