USD/CAD Forecast — 22 August 2026
Time Zone: GMT +3
Time Frame: Daily (D1) / Weekly Outlook
Weekly Fundamental Overview:
USD/CAD faces heightened market focus as traders evaluate economic trajectory and policy expectations for both the US Dollar and Canadian Dollar. Key upcoming macroeconomic releases are expected to shape currency valuation and overall sentiment across the pair.
Price Action:
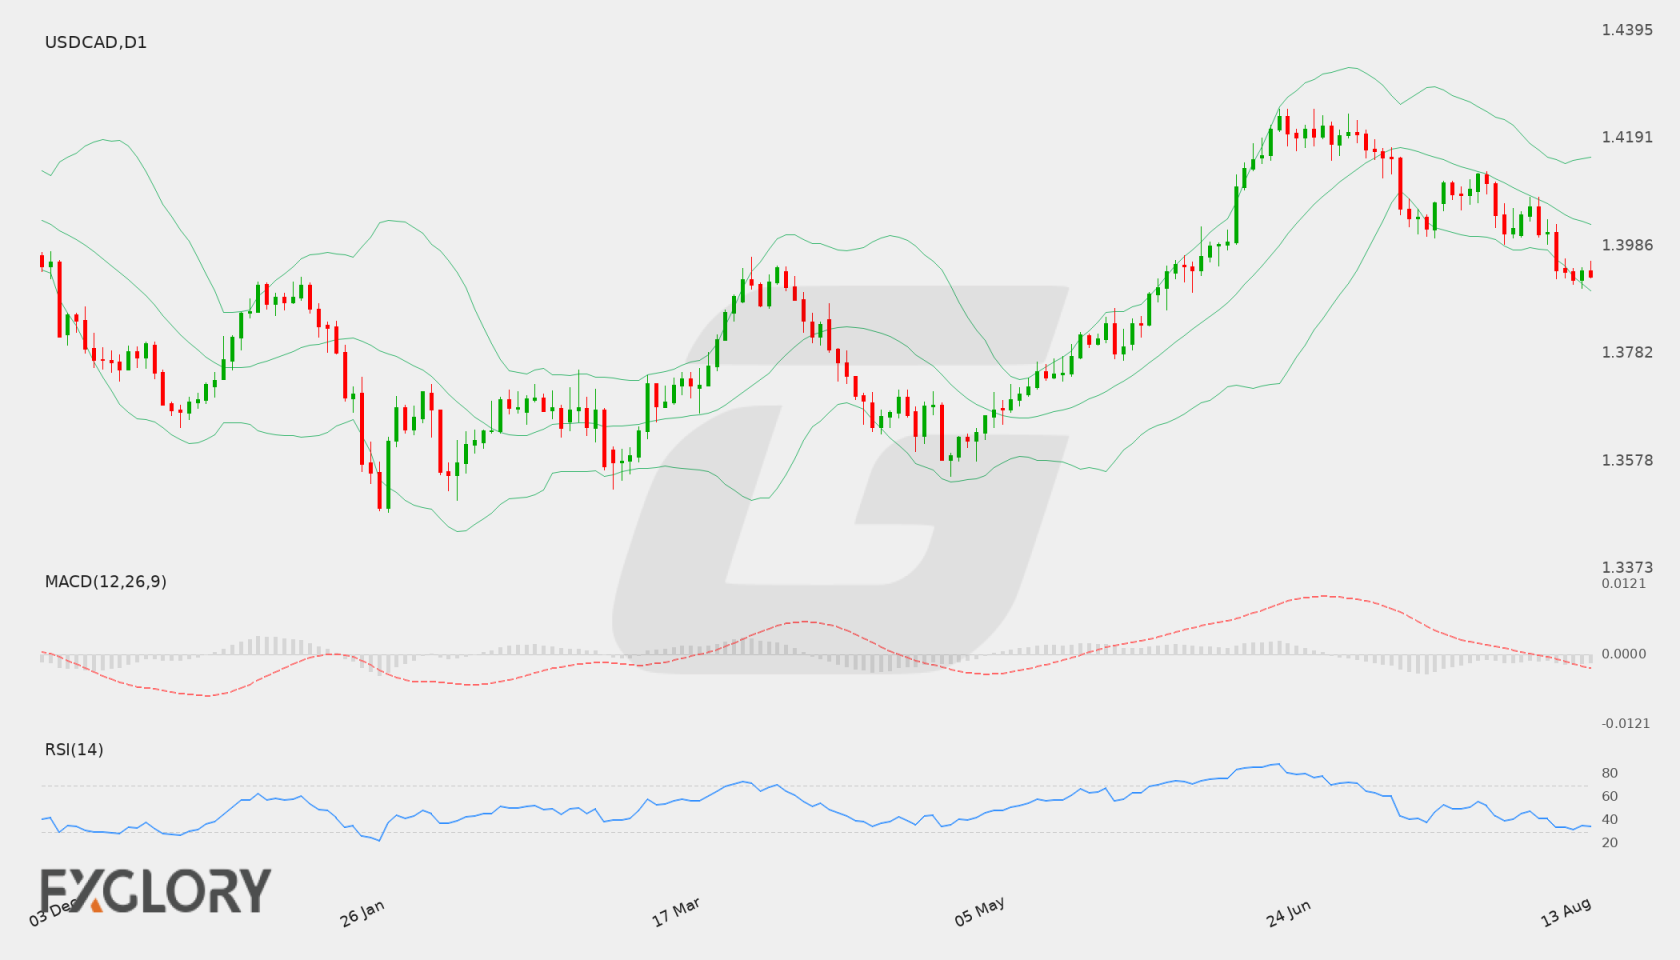
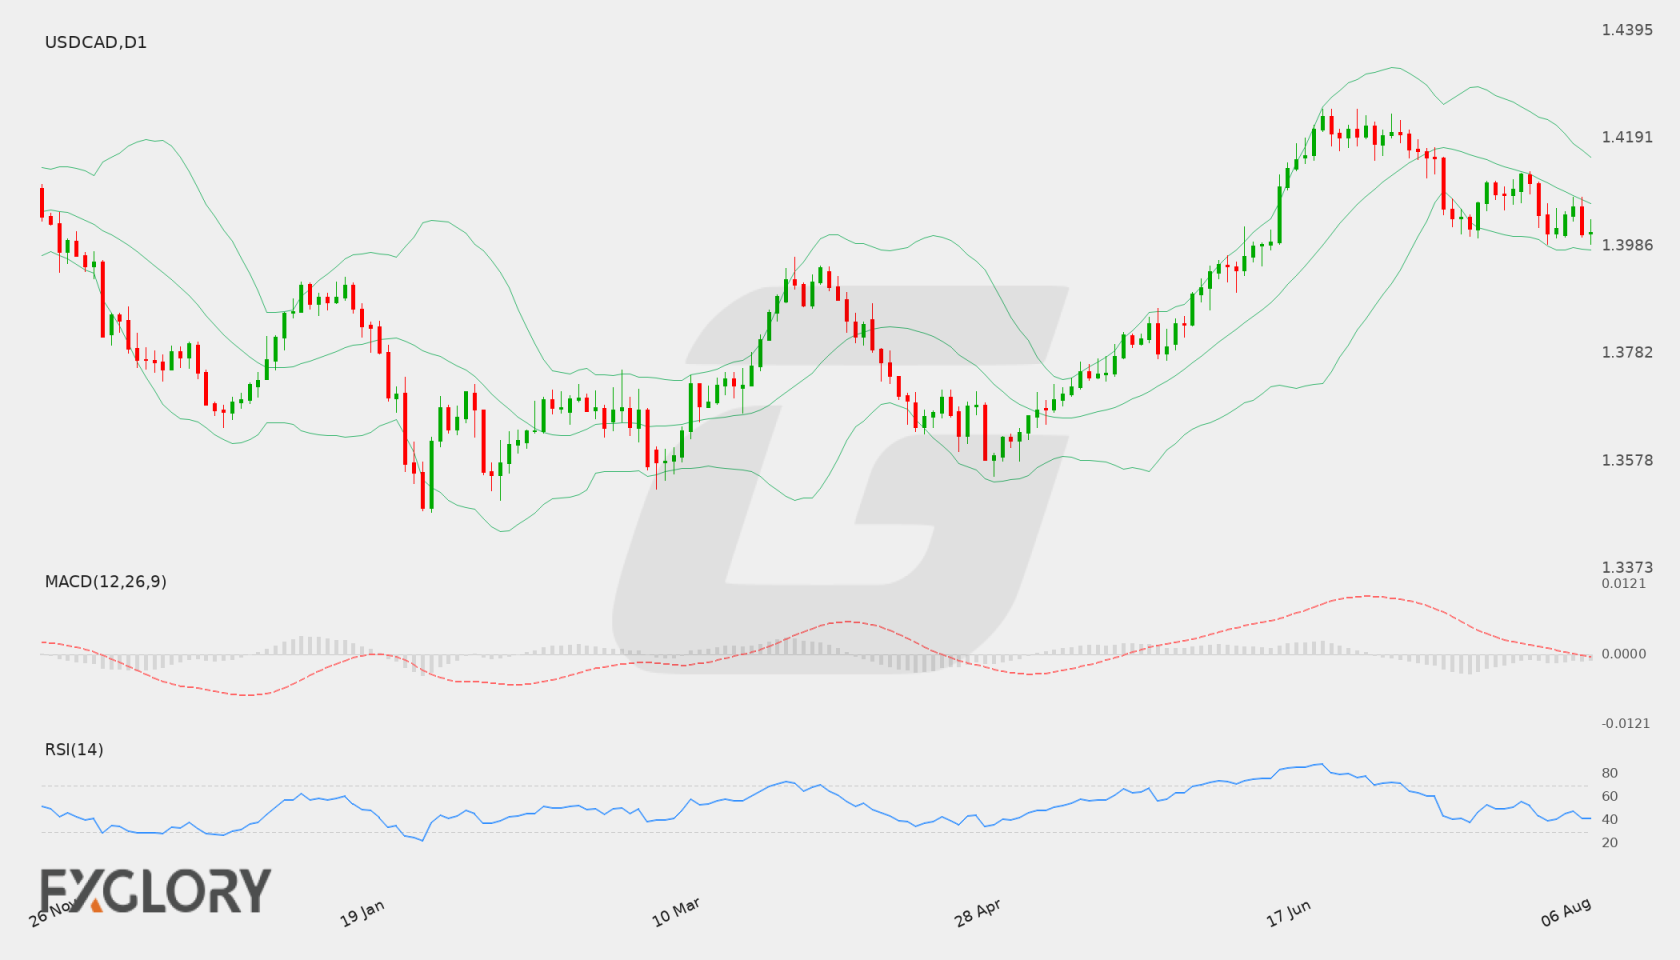
On the daily D1 chart, USD/CAD has extended a clear downward trajectory, dropping from levels near 1.4200 to a recent close of 1.37878. The series of lower daily closes reflects sustained selling interest, positioning price action near key lower thresholds.
Key Technical Indicators:
Bollinger Bands: The D1 Bollinger Bands indicate a middle line at 1.39713, an upper band at 1.41585, and a lower band at 1.37841. With the current close at 1.37878 resting almost directly on the lower band, price action is testing lower volatility boundary limits.
RSI: The 14-day Relative Strength Index (RSI) is currently reading 24.99. Staying well below the 30 level, the oscillator signals that the instrument is in oversold territory, which may indicate potential for temporary consolidation or corrective pullbacks.
MACD: The MACD indicator on the daily chart stands at -0.006415, staying below the zero line. This negative reading indicates ongoing downward momentum for USD/CAD as sellers maintain control of the prevailing trend.
Support and Resistance:
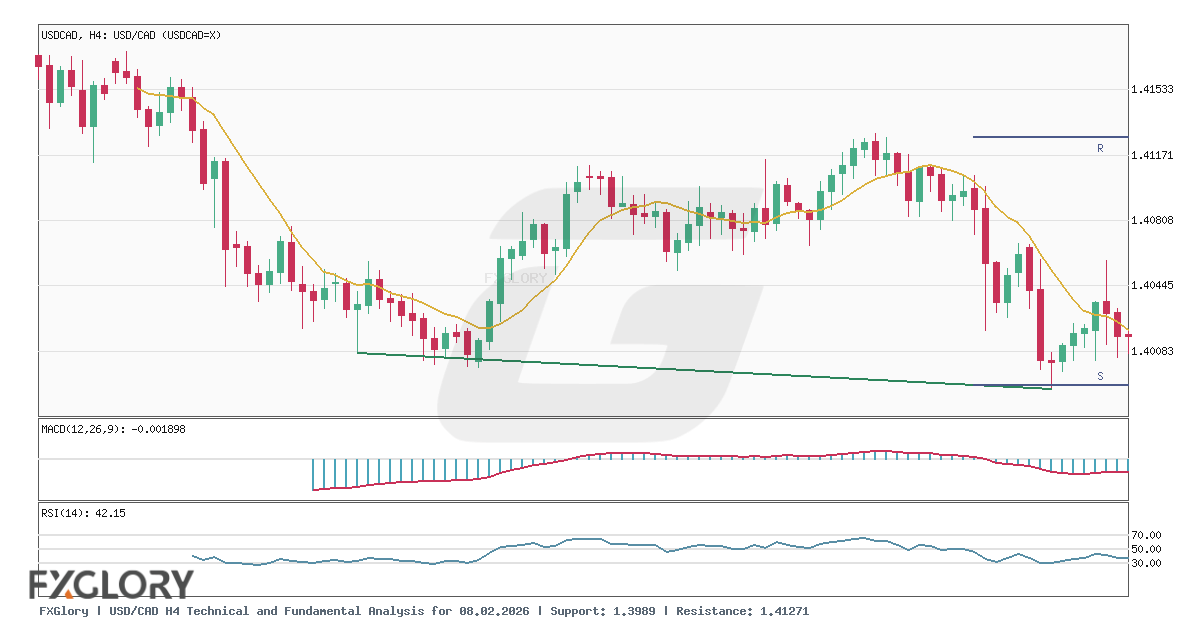
Key technical support is established at 1.37538, representing a major level near recent daily lows. On the upside, main resistance sits at 1.42463, while the middle Bollinger Band at 1.39713 serves as intermediate dynamic resistance.
News to Watch for USDCAD This Week:
- CB Consumer Confidence: Gauges consumer economic outlook and can affect overall USD sentiment.
- Core PCE Price Index m/m: Serves as a primary inflation gauge that influences central bank policy expectations.
- Prelim GDP q/q: Reflects underlying economic growth trends and impacts market view on dollar strength.
- Prelim GDP Price Index q/q: Indicates broader price pressures across economic output.
- Unemployment Claims: Provides timely updates on labor market health and economic resilience.
- GDP m/m: Highlights monthly Canadian economic performance and impacts CAD demand.
- Prelim Benchmark Payrolls Revision: Reveals significant updates to employment statistics that can shift rate forecasts.
Weekly Outlook and Consideration:
USD/CAD approaches the new trading session in a strong downside trend, closing at 1.37878 near its daily lower Bollinger Band of 1.37841. A negative MACD at -0.006415 reinforces bearish price momentum, though an RSI of 24.99 points to heavily oversold conditions. A sustained breakdown below support at 1.37538 could open space for further declines, whereas holding above this floor may invite a temporary bounce toward upper resistance levels up to 1.42463 amid significant economic news releases.
Disclaimer: The analysis provided for USD/CAD is for informational purposes only and does not constitute investment advice. Traders are encouraged to perform their own analysis and research before making any trading decisions. Market conditions can change quickly, so staying informed with the latest data is essential.