Current weekly forecast: This outlook covers 18–24 October 2026 and remains valid until 24 October 2026, unless its stated invalidation condition is triggered earlier.
Daily check — 19 October 2026: The latest completed D1 close was 111.719 on 16 October 2026. It remains below the upper formal invalidation level 112.684; the lower calibrated boundary 110.362 is an extension/confirmation boundary. The authored weekly thesis remains valid.
In brief
CAD/JPY has a bearish weekly bias, although bullish H4 momentum and mixed D1 price action could delay or complicate the broader downside structure.
The weekly thesis is controlled by the D1 bearish trend. The 111.366 reference close is below the 111.37874 EMA20, 112.30197 EMA50 and 114.24742 SMA200, while both the EMA50 and SMA200 slopes are falling. That structure keeps the downside case active, but the mixed D1 close sequence means the move is not presenting as a uniformly directional progression.
Momentum adds a qualified rather than decisive signal: D1 RSI is 46.91 and the MACD remains negative at -0.37962, although the positive 0.134335 histogram indicates some improvement relative to the signal relationship. H4 is more constructive, with RSI at 65.08 and positive MACD readings, so a move toward 111.788 and potentially 112.30197 would represent tactical countertrend pressure rather than an automatic change in the D1 thesis.
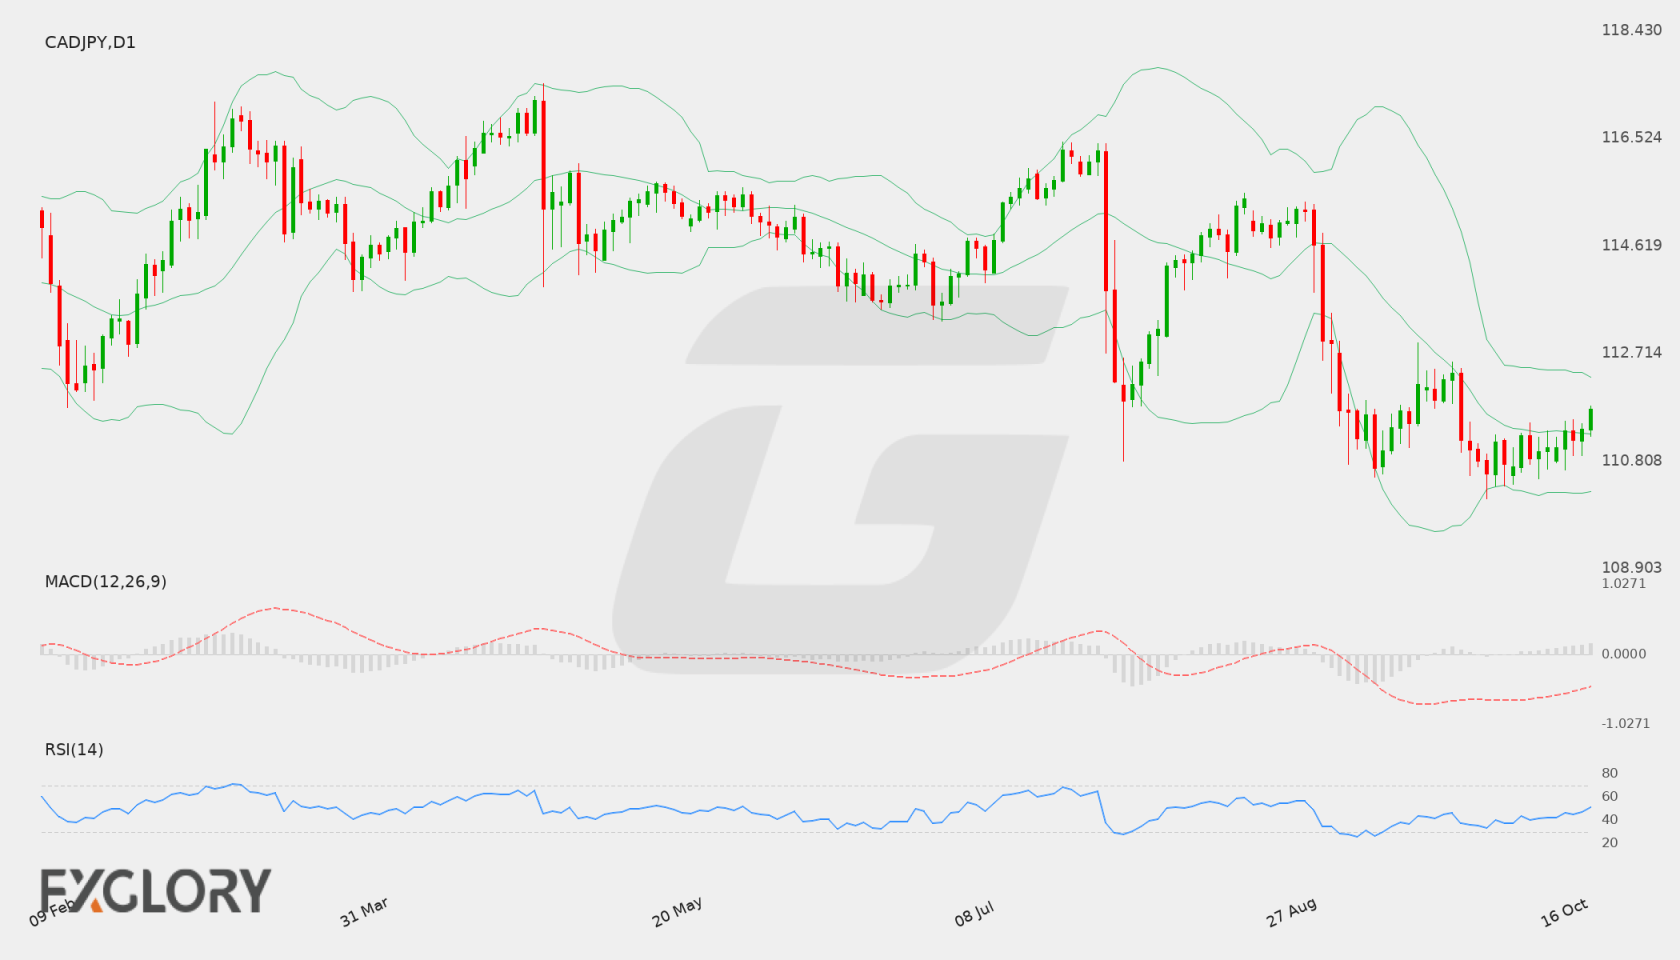
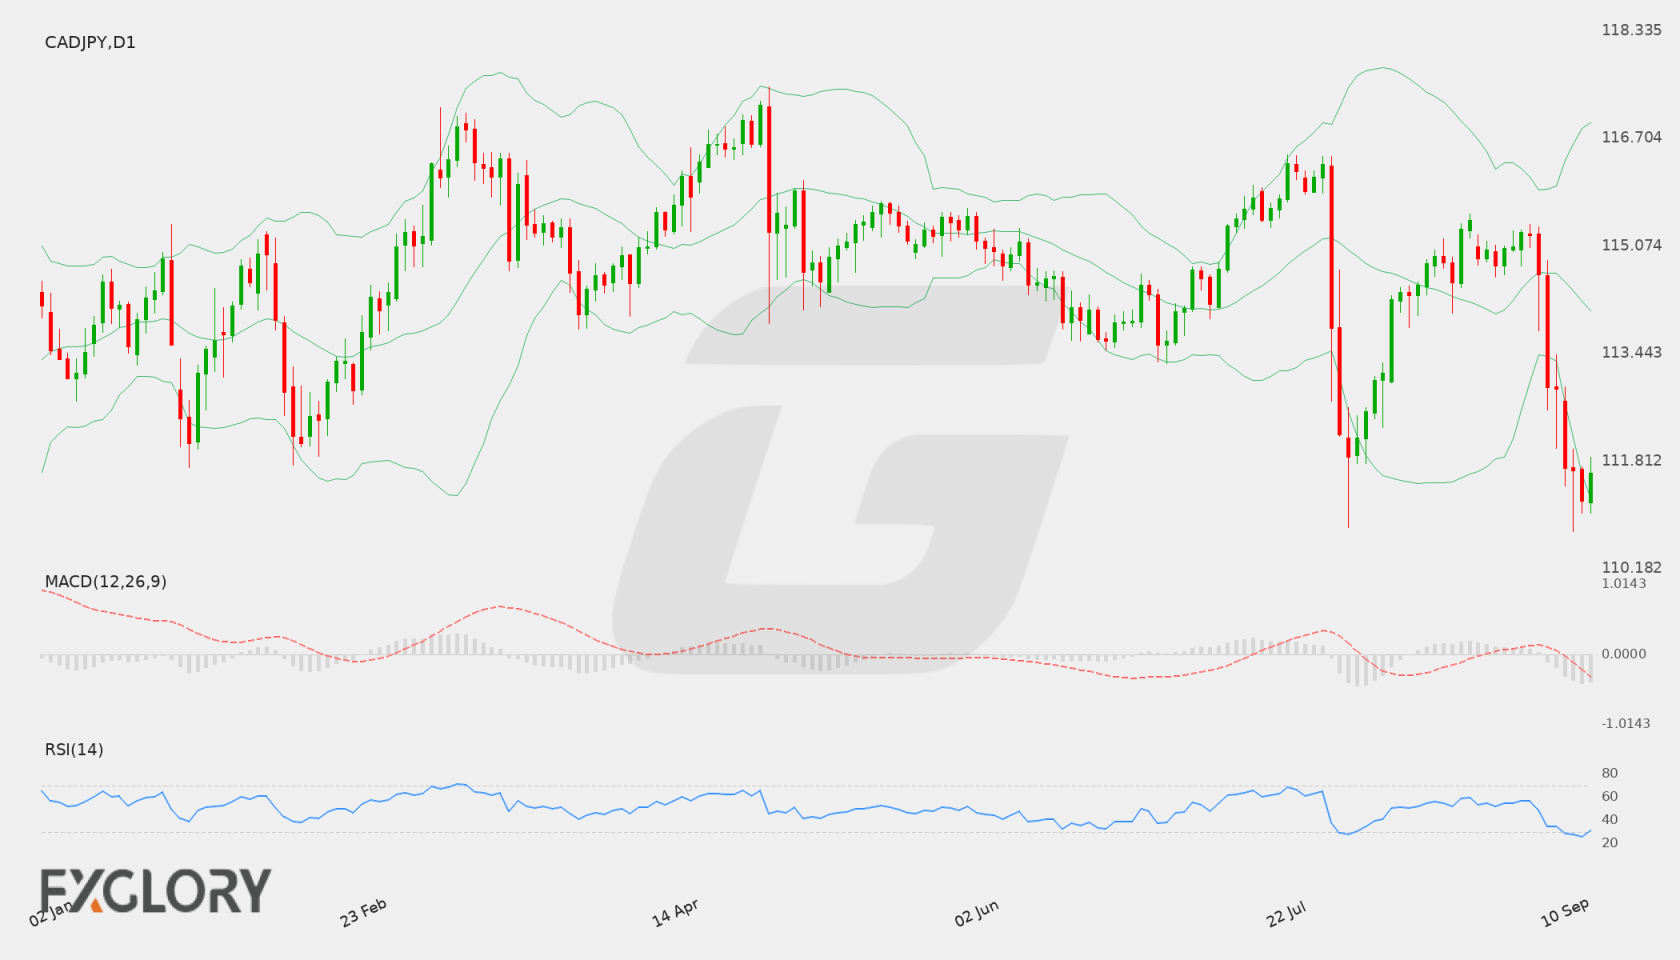
CAD/JPY D1 technical-analysis context for the weekly forecast. Chart data captured 19 October 2026.
CAD/JPY has a bearish weekly bias, although bullish H4 momentum and mixed D1 momentum make movement toward 110.141 conditional rather than immediate.
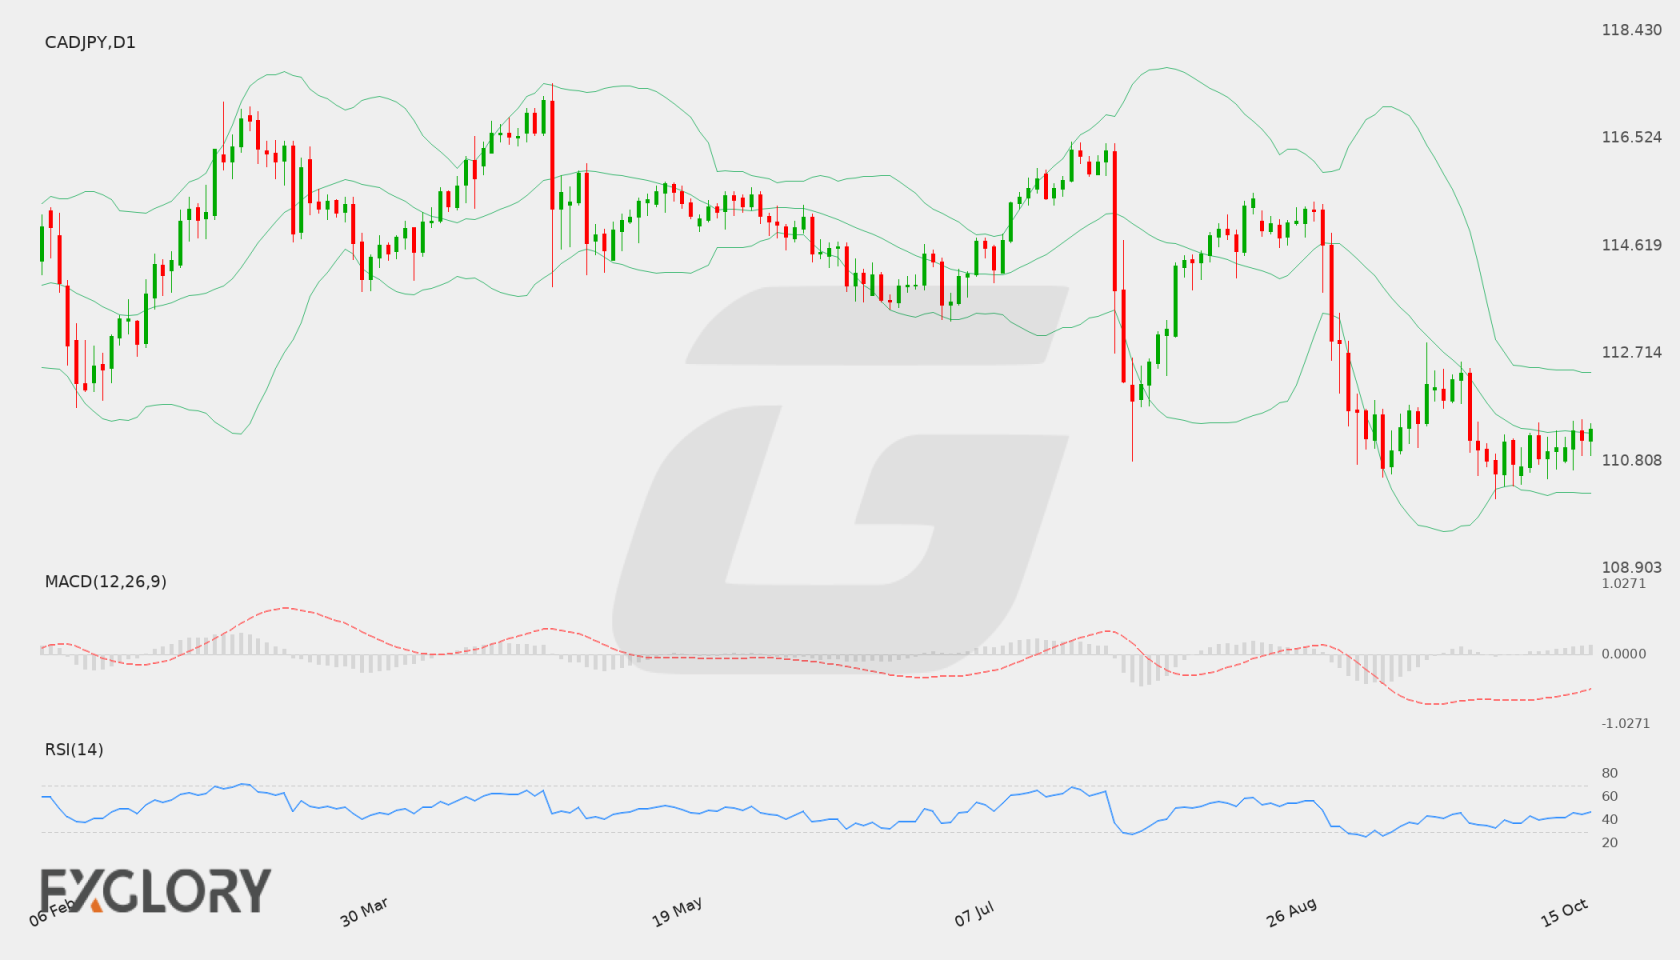
The controlling D1 picture remains bearish: the 111.038 close is below the EMA20 at 111.44428, EMA50 at 112.48631 and SMA200 at 114.28803, while both the EMA50 and SMA200 slopes are falling. This establishes a weaker higher-timeframe structure, with 110.553 and 110.141 as the key downside reference levels.
The setup is not one-directional. D1 momentum is mixed, the D1 close sequence is mixed, and H4 is bullish with RSI at 56.07 and a positive MACD histogram, so a recovery toward 111.489 and potentially the ATR-based reference targets at 112.4203 and 112.898 remains a conditional alternative. A completed D1 close above 112.19191 would materially challenge the bearish framework.
CAD/JPY D1 technical-analysis context for the weekly forecast. Chart data captured 16 October 2026.
CAD/JPY traders are keeping a close eye on economic conditions in Canada and Japan, with broader macroeconomic trends exerting influence over pair valuations. Upcoming Canadian economic growth statistics are poised to act as a significant driver for relative currency valuation in the upcoming sessions.
Price Action:
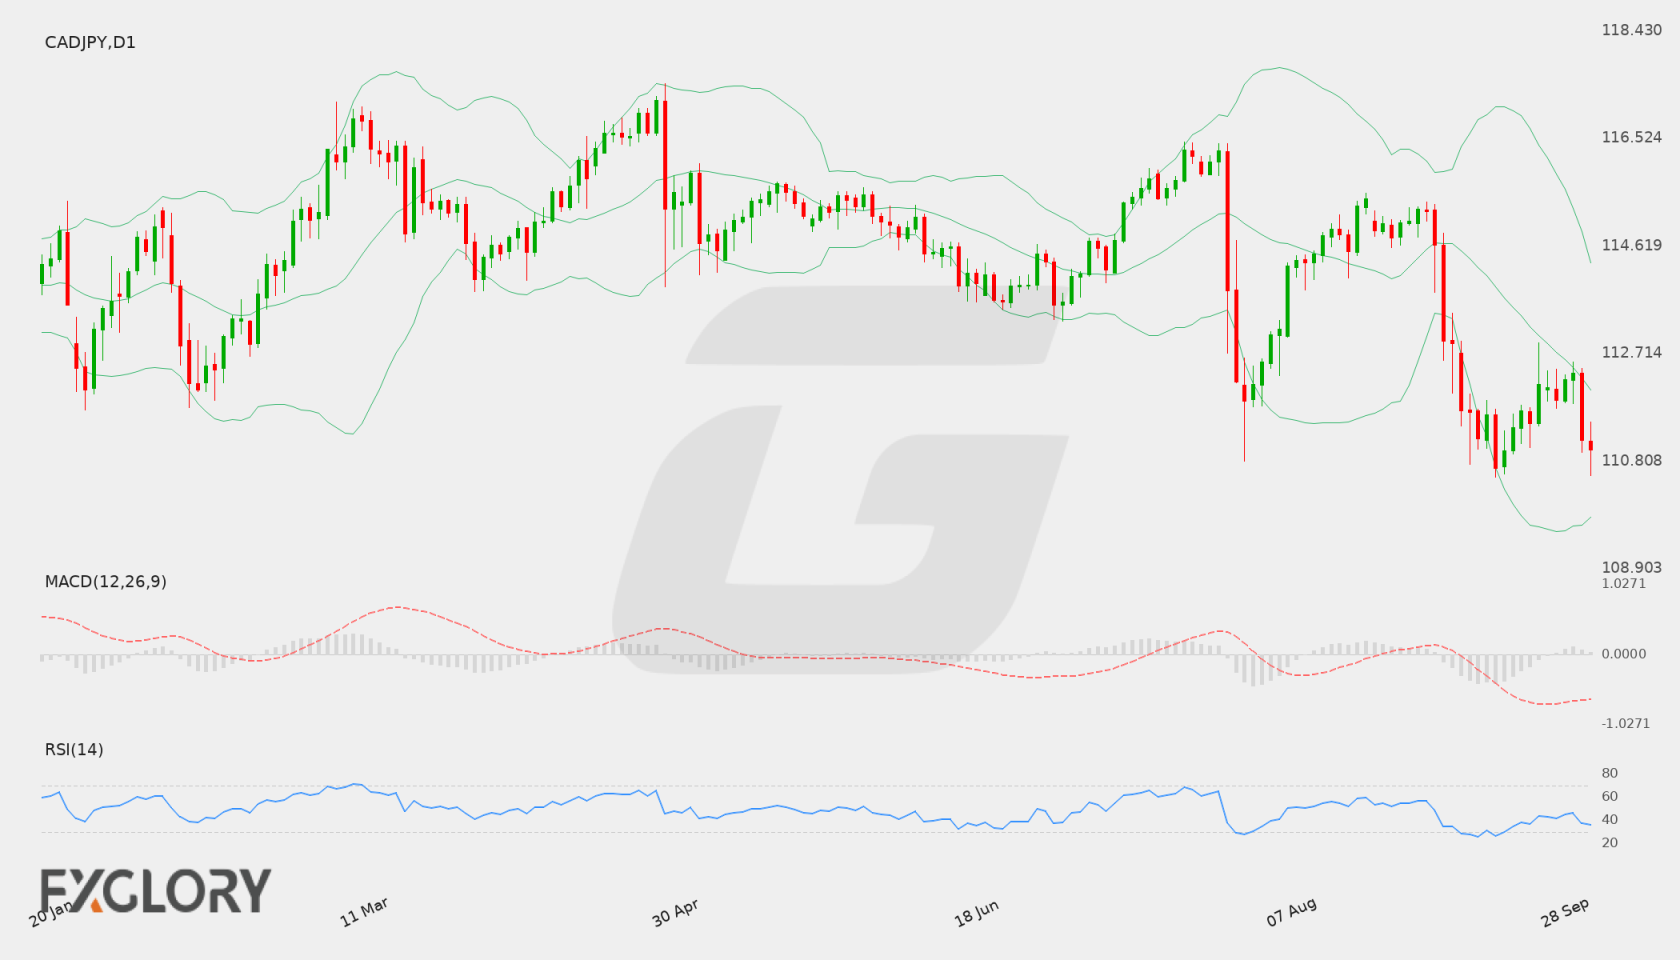
The daily D1 chart shows recent downward momentum for CAD/JPY, with the pair dropping from recent trading levels around 112.359 down to a recent close at 111.013. The step-down in daily candles highlights active selling interest as price tests lower ranges.
Key Technical Indicators:
Bollinger Bands: The daily Bollinger Bands reveal a middle band at 112.059, an upper band at 114.314, and a lower band at 109.804. Trading at 111.013, the price sits beneath the middle band, signaling a bearish environment as it moves toward the lower band boundary.
RSI: The 14-day Relative Strength Index (RSI) is currently recorded at 36.15. Resting below the neutral 50 level, it signals dominant bearish pressure while remaining above the traditional oversold threshold of 30.
MACD: The MACD line is positioned below the signal line in negative territory with a value of -0.635. This negative value reflects sustained bearish momentum across the daily timeframe for CAD/JPY.
Support and Resistance:
Key technical benchmarks for CAD/JPY are defined by support at 110.524 and resistance at 116.454. With the pair closing at 111.013, price is currently hovering closer to the immediate support zone.
News to Watch for CADJPY This Week:
GDP m/m: Monthly Canadian economic growth data provides crucial economic insight that could sway CAD strength against the Japanese yen.
Weekly Outlook and Consideration:
The weekly perspective for CAD/JPY remains weighted toward the downside as technical indicators point toward prevailing bearish bias. With the RSI at 36.15 and MACD at -0.635, the pair trades under the Bollinger middle band of 112.059. A break below immediate support at 110.524 could open the path toward lower territory near the lower Bollinger band at 109.804, whereas any relief rebound would confront overhead resistance towards 116.454.
Disclaimer: The analysis provided for CAD/JPY is for informational purposes only and does not constitute investment advice. Traders are encouraged to perform their own analysis and research before making any trading decisions. Market conditions can change quickly, so staying informed with the latest data is essential.
The CAD/JPY pair remains influenced by macroeconomic trends across Canada and Japan as traders monitor central bank policy stances and growth prospects. Economic performance indicators from Canada and inflation signals from Japan are key drivers shaping trader sentiment and cross-currency flows in the near term.
Price Action:
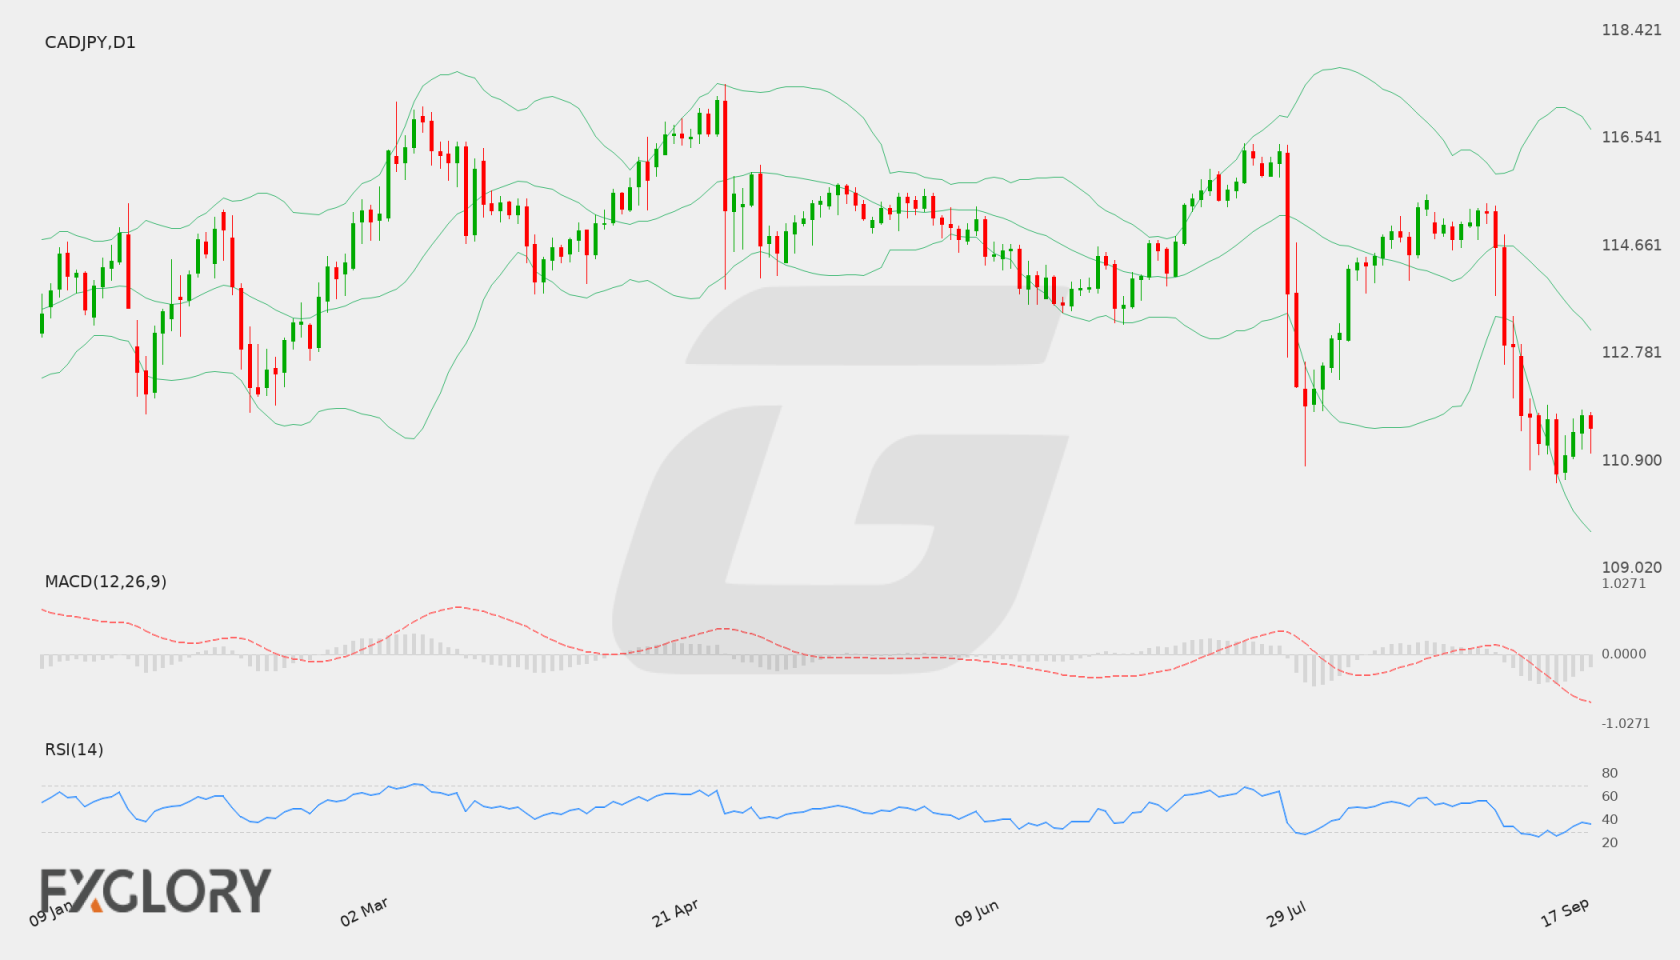
On the daily (D1) chart, CAD/JPY closed at 111.484 after bouncing off a recent low near 110.524. Recent price action indicates a retracement from prior highs near 116.454, with the pair striving to establish stability following a period of persistent selling pressure.
Key Technical Indicators:
Bollinger Bands: The D1 Bollinger Bands show a middle line at 113.186, with the upper band at 116.704 and lower band at 109.669. With price trading at 111.484 between the middle and lower bands, the technical setup reflects prevailing downside momentum within the expanded volatility envelope.
RSI: The 14-day RSI is currently at 36.29, holding in bearish territory but remaining above the oversold boundary of 30. This signals weak upward momentum while leaving room for potential temporary consolidation.
MACD: The MACD indicator is currently reading -0.892, remaining below the signal line and entrenched in negative territory. This reading highlights ongoing bearish momentum on the daily chart, though stabilizing price bars could slow down further downside trajectory.
Support and Resistance:
Key technical levels for CAD/JPY show immediate support at 110.524, which served as a recent floor for price declines. On the resistance side, 116.454 acts as a critical ceiling that buyers would need to break to shift the broader trend back upward.
News to Watch for CADJPY This Week:
GDP m/m: Monthly measure of Canadian economic activity that offers critical insight into growth dynamics and potential central bank policy actions.
Tokyo Core CPI y/y: Key inflation indicator for Japan's capital city that provides early clues on national price trends and monetary policy direction.
Weekly Outlook and Consideration:
CAD/JPY approaches the new trading week with a cautious tone following a close at 111.484. Momentum indicators such as the RSI at 36.29 and MACD at -0.892 remain aligned to the downside while price trades beneath the middle Bollinger Band of 113.186. A sustained push above current levels could target the major resistance near 116.454, whereas a fall below support at 110.524 could direct price action toward the lower Bollinger Band around 109.669.
Disclaimer: The analysis provided for CAD/JPY is for informational purposes only and does not constitute investment advice. Traders are encouraged to perform their own analysis and research before making any trading decisions. Market conditions can change quickly, so staying informed with the latest data is essential.
Fundamental drivers for CAD/JPY center on inflation developments and central bank policy stances. Rate expectations in Canada alongside upcoming monetary policy decisions from the Bank of Japan could influence yield differentials and cross-currency risk dynamics for CAD/JPY.
Price Action:
CAD/JPY has experienced a distinct downward trajectory on the daily timeframe, dropping from recent highs near 116.454 down to a recent close of 111.628. The price tested recent lows near the 110.744 mark, displaying persistent selling interest while attempting to find footing near key support.
Key Technical Indicators:
Bollinger Bands: The daily Bollinger Bands show CAD/JPY trading close to the lower band of 111.242, well beneath the middle band at 114.093 and the upper band at 116.945. This positioning underscores increased downside volatility and sustained selling pressure across daily candles.
RSI: The 14-day Relative Strength Index (RSI) is positioned at 30.80, nearing oversold conditions, which indicates strong downside momentum while signaling potential for market consolidation.
MACD: The daily MACD for CAD/JPY stands at -0.728, remaining in negative territory below the zero line to reflect ongoing bearish momentum in the pair.
Support and Resistance:
Technical analysis highlights immediate key support for CAD/JPY at 110.744, with primary overhead resistance identified at 116.454.
Common CPI y/y: Assesses broad inflationary trends across consumer expenditures.
Monetary Policy Statement: Outlines economic evaluations and policy guidelines from the central bank.
BOJ Press Conference: Provides verbal insights and economic commentary regarding future interest rate pathways.
BOJ Policy Rate: Establishes benchmark interest rates, impacting currency yields and market valuations.
Weekly Outlook and Consideration:
The weekly outlook for CAD/JPY leans cautious as the pair trades near 111.628 following a sustained drop from the 116.454 resistance level. Technical indicators on the daily chart reflect notable bearish momentum, with MACD at -0.728 and RSI at 30.80 hovering near oversold territory. Trading near the lower Bollinger Band at 111.242, CAD/JPY market participants will be closely watching whether key support at 110.744 holds or gives way during upcoming economic releases.
Disclaimer: The analysis provided for CAD/JPY is for informational purposes only and does not constitute investment advice. Traders are encouraged to perform their own analysis and research before making any trading decisions. Market conditions can change quickly, so staying informed with the latest data is essential.