
EURCAD Forecast

EUR/CAD Forecast — 3 October 2026

Time Zone: GMT +3

Time Frame: Daily (D1) / Weekly Outlook

Weekly Fundamental Overview:

EUR/CAD dynamics continue to reflect comparative economic momentum between the Eurozone and Canada. While regional growth trajectories and interest rate trajectories dictate broader positioning, upcoming Canadian labor and activity data could alter cross-currency valuation, keeping the Canadian dollar responsive to domestic performance.

Price Action:

On the daily timeframe, EUR/CAD experienced substantial downside pressure during the latest trading session, dropping sharply from an open of 1.61219 to a close of 1.59834. The pair established a daily low of 1.59750, breaking beneath prior consolidation and finishing near its daily floor.

Key Technical Indicators:

Bollinger Bands: The Bollinger Bands feature a middle band at 1.60665, an upper band at 1.61312, and a lower band at 1.60018. The latest close at 1.59834 has penetrated below the lower band, reflecting an expansion in downward volatility and pushing the pair into an oversold technical posture relative to its 20-day band structure.

RSI: The 14-period Relative Strength Index (RSI) is calculated at 38.93. This reading places EUR/CAD below the neutral 50 threshold, confirming bearish dominance while holding just above the traditional oversold benchmark of 30.

MACD: The daily MACD line sits in negative territory at -0.00044. This negative value indicates that downward momentum remains intact, demonstrating sustained selling pressure over recent sessions.

Support and Resistance:

Immediate daily support aligns directly at 1.59750, matching the recent session low. Overhead, primary resistance is defined at 1.62454, while the middle Bollinger Band at 1.60665 serves as intermediate dynamic resistance.

News to Watch for EURCAD This Week:

  • Ivey PMI: This index provides insight into Canadian business activity and purchasing managers' sentiment, potentially altering demand for the Canadian dollar.
  • Unemployment Rate: This reading indicates the degree of labor market tightness in Canada and plays an important role in shaping monetary policy outlooks.
  • Employment Change: This metric tracks net monthly job creation and serves as a primary catalyst for Canadian dollar volatility.

Weekly Outlook and Consideration:

EUR/CAD concluded the recent session under firm bearish pressure, settling at 1.59834 after breaching the lower Bollinger Band at 1.60018. Momentum remains tilted to the downside, corroborated by a negative MACD reading of -0.00044 and an RSI at 38.93. The critical daily support level at 1.59750 is under immediate test. A sustained defense of this base could allow for a stabilization phase or a technical rebound back toward the middle Bollinger Band at 1.60665. Conversely, if sellers maintain control and drive price decisively below 1.59750, EURCAD may extend its downward movement, whereas bulls would need to overcome resistance at 1.62454 to re-establish an upward trajectory.

Disclaimer: The analysis provided for EUR/CAD is for informational purposes only and does not constitute investment advice. Traders are encouraged to perform their own analysis and research before making any trading decisions. Market conditions can change quickly, so staying informed with the latest data is essential.
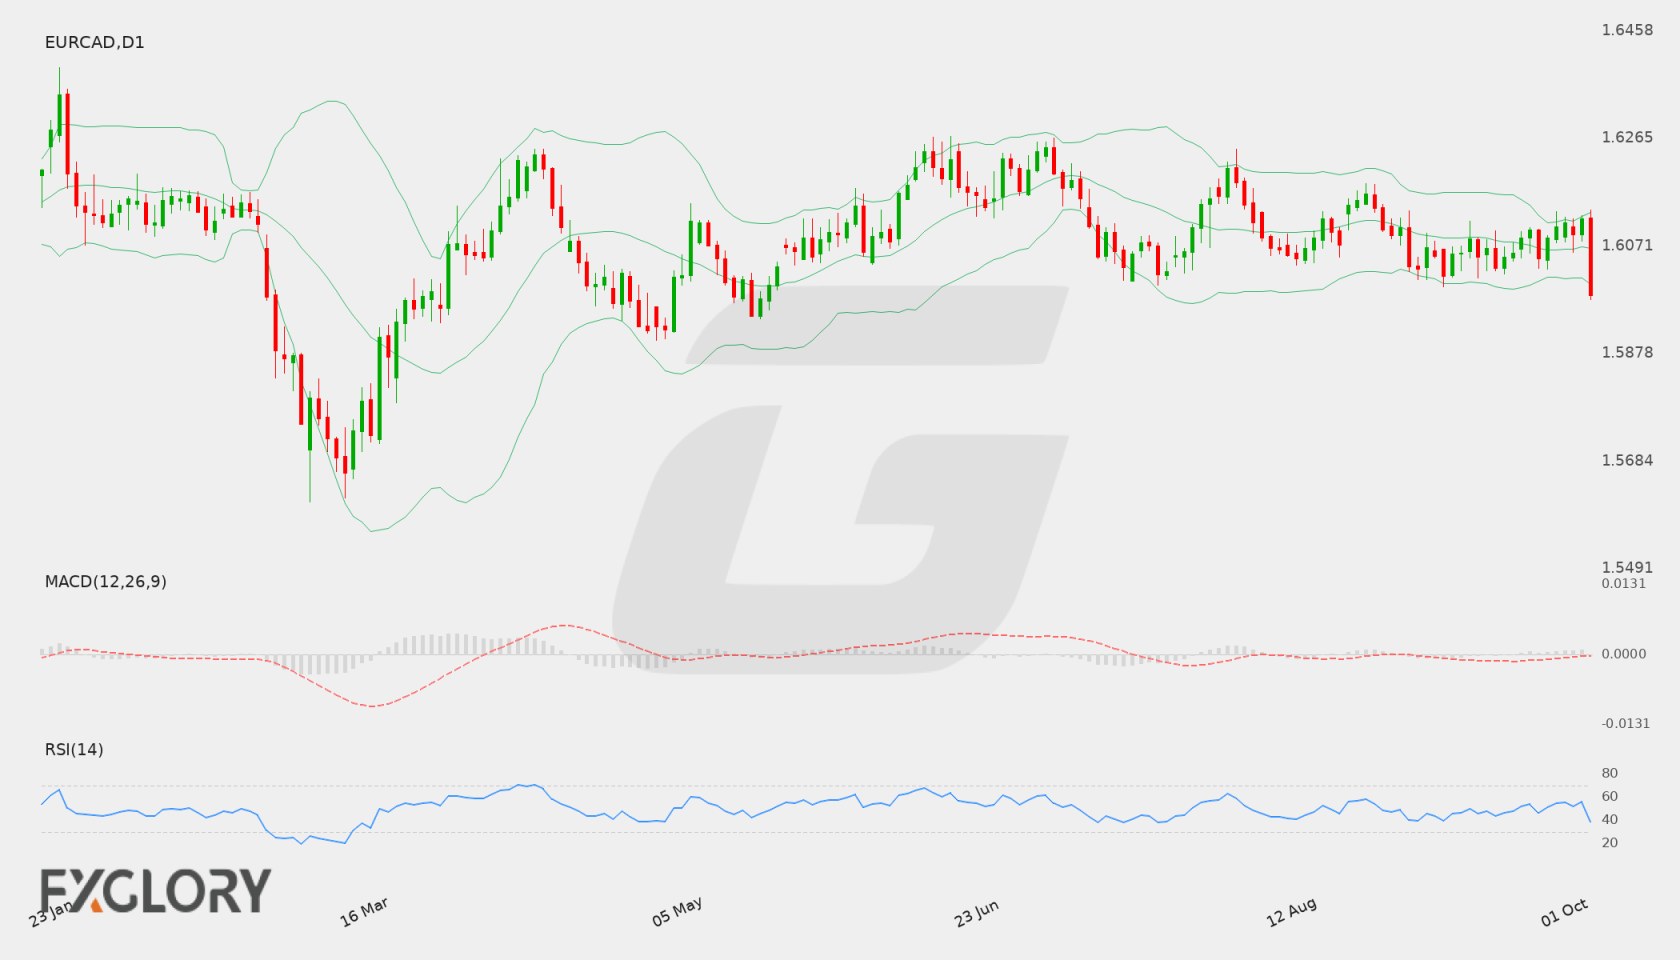
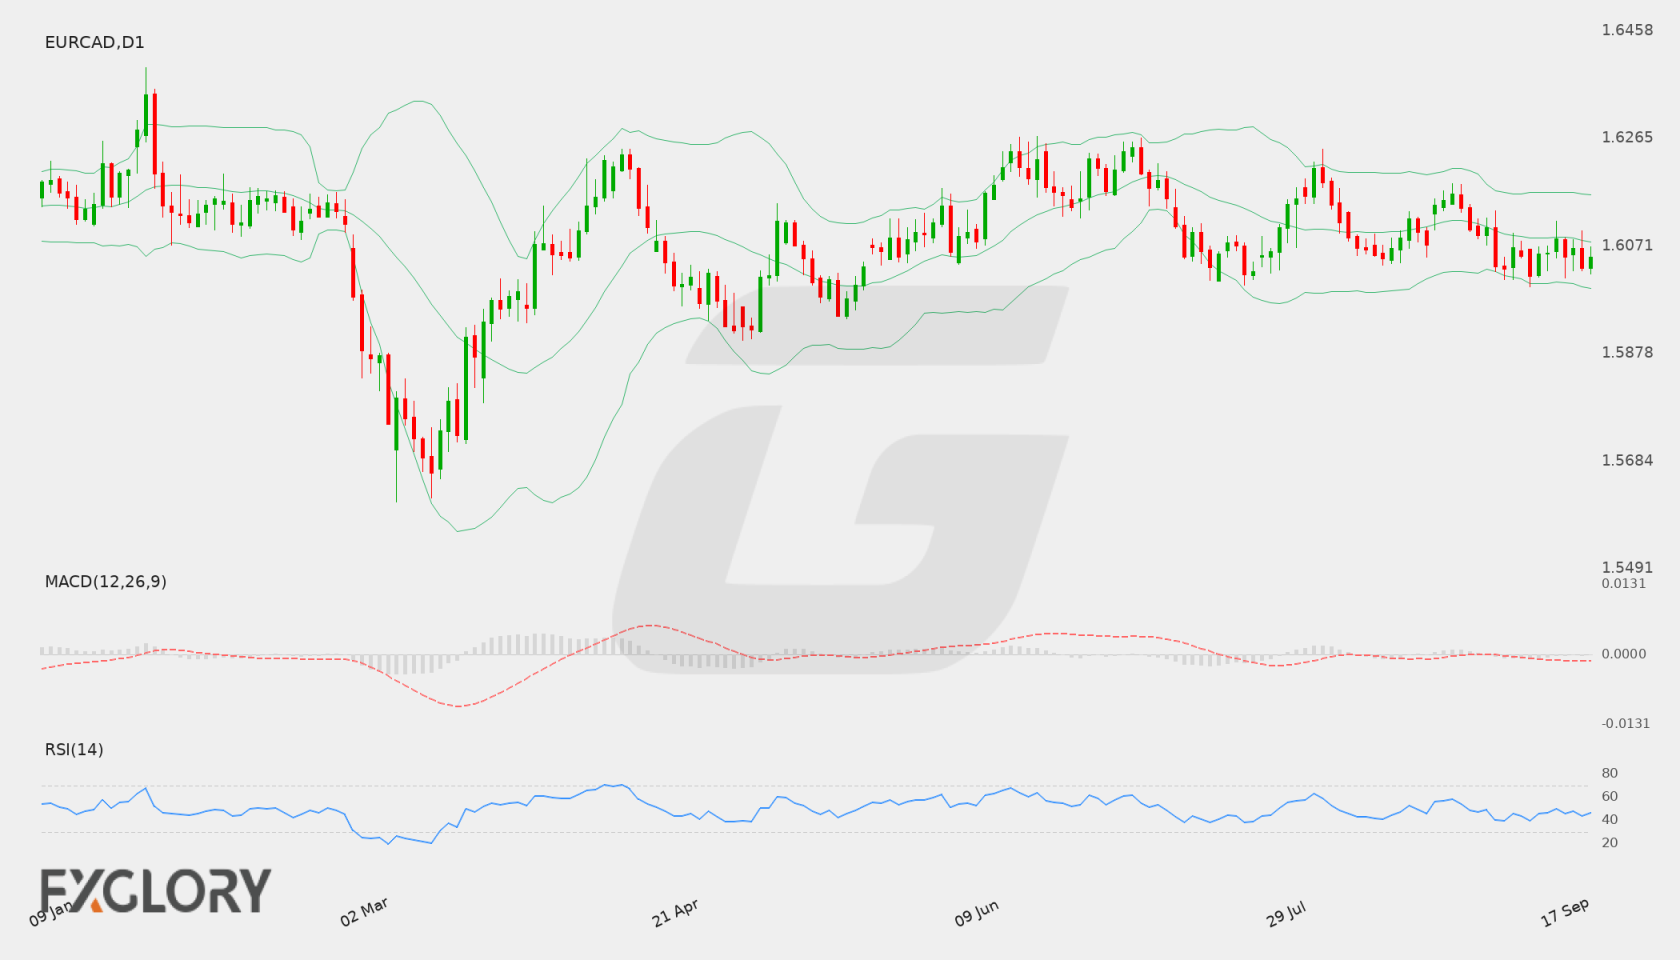
EUR/CAD D1 technical analysis chart
EUR/CAD D1 Technical Analysis for 10.03.2026

EUR/CAD Forecast — 20 September 2026

Time Zone: GMT +3

Time Frame: Daily (D1) / Weekly Outlook

Weekly Fundamental Overview:

EUR/CAD market sentiment remains tied to upcoming economic data from both Canada and the Eurozone. Key economic indicators, including Canadian GDP growth figures and Eurozone inflation metrics, will be closely evaluated by market participants to gauge potential monetary policy adjustments.

Price Action:

On the Daily (D1) chart, EUR/CAD has exhibited short-term consolidation around the 1.60502 closing level. Recent price candles reflect range-bound activity between recent minor session lows near 1.60180 and local session highs around 1.60835.

Key Technical Indicators:

Bollinger Bands: The D1 Bollinger Bands depict a middle band at 1.60788, an upper band at 1.61629, and a lower band at 1.59948. Price action closing at 1.60502 sits just below the middle line, signaling a neutral to slightly restrained market posture.

RSI: The 14-day Relative Strength Index (RSI) stands at 46.06, indicating a neutral state. This level indicates an absence of overbought or oversold conditions.

MACD: The MACD indicator is currently reading -0.00149, positioning it below the zero baseline. This negative value points to mild bearish bias without strong momentum expansion.

Support and Resistance:

Technical support for EUR/CAD is established near 1.59977, close to the lower Bollinger Band region. On the upside, key technical resistance is identified around 1.62649.

News to Watch for EURCAD This Week:

  • GDP m/m: Canadian monthly economic growth figures may influence market sentiment and valuation.
  • German Prelim CPI m/m: Preliminary German inflation data provides preliminary signals regarding price trends in the Eurozone.
  • CPI Flash Estimate y/y: Headline Eurozone inflation figures offer broad insight into regional consumer price pressures.
  • Core CPI Flash Estimate y/y: Underlying Eurozone inflation metrics help evaluate long-term price stability trends.

Weekly Outlook and Consideration:

EUR/CAD trades with a neutral bias following a close at 1.60502, situated slightly under the daily Bollinger middle band of 1.60788. Neutral RSI readings at 46.06 and a modest negative MACD at -0.00149 suggest bounded price movement. Key levels to monitor include support at 1.59977 and resistance at 1.62649, alongside key GDP and inflation data releases.

Disclaimer: The analysis provided for EUR/CAD is for informational purposes only and does not constitute investment advice. Traders are encouraged to perform their own analysis and research before making any trading decisions. Market conditions can change quickly, so staying informed with the latest data is essential.
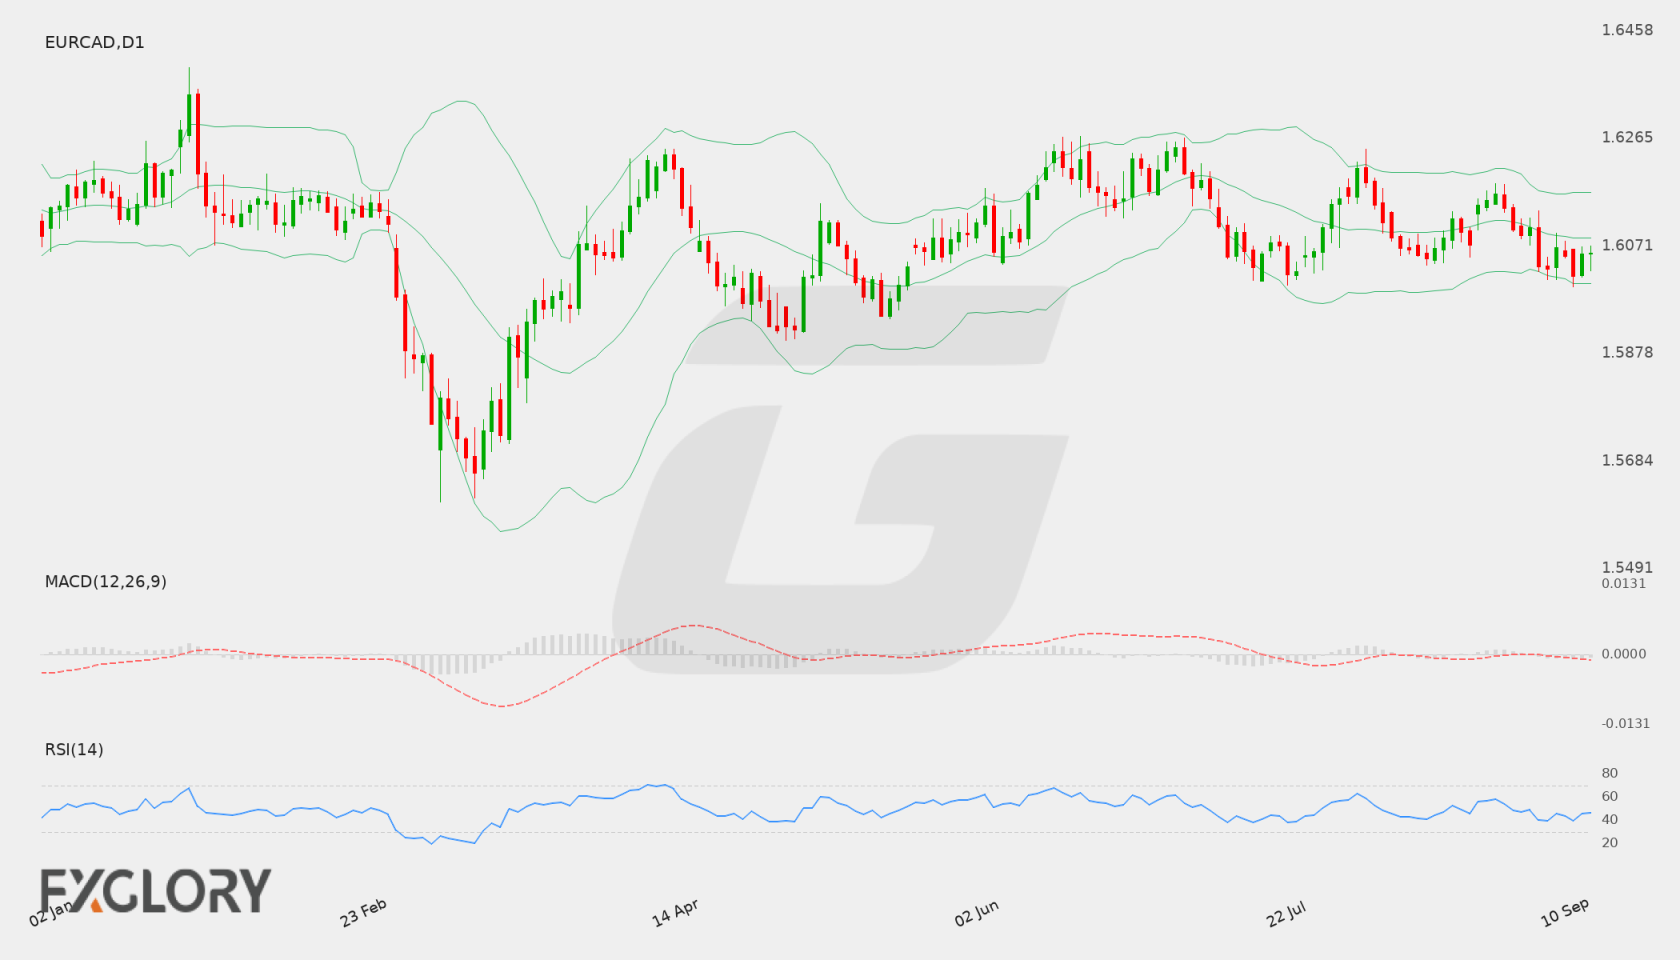
EUR/CAD D1 technical analysis chart
EUR/CAD D1 Technical Analysis for 09.20.2026

EUR/CAD Forecast — 12 September 2026

Time Zone: GMT +3

Time Frame: Daily (D1) / Weekly Outlook

Weekly Fundamental Overview:

The EUR/CAD pair remains influenced by monetary policy expectations and incoming economic performance data from both the Eurozone and Canada. Attention shifts toward upcoming inflation indicators for Canada, which may shape interest rate expectations and drive sentiment across the currency cross. Overall risk sentiment and broader market conditions continue to play a pivotal role in dictating medium-term direction.

Price Action:

On the Daily (D1) timeframe, EUR/CAD recently closed at 1.60585, reflecting short-term stabilization after rebounding from a daily low near 1.60180. The recent price trajectory shows consolidation near the 1.6050 region following a descent from higher levels above 1.6200.

Key Technical Indicators:

Bollinger Bands: The D1 Bollinger Bands indicate a middle band at 1.60855, an upper band at 1.61676, and a lower band at 1.60033. Trading at 1.60585, the pair rests in the lower half of the band range, pointing to minor downward bias within the volatility envelope.

RSI: The 14-day Relative Strength Index (RSI) is holding at 45.99, remaining in neutral territory just below the 50 mark, which reflects moderate bearish momentum without entering oversold conditions.

MACD: The MACD indicator is currently registering at -0.00165, maintaining a position below the zero line and signaling lingering negative momentum on the daily chart.

Support and Resistance:

Key daily technical levels for EUR/CAD include technical support at 1.59977 and key resistance at 1.62683, with the middle Bollinger Band at 1.60855 acting as an immediate resistance zone.

News to Watch for EURCAD This Week:

  • Trimmed CPI y/y: This inflation metric provides insight into underlying price trends that could influence central bank policy outlooks.
  • Median CPI y/y: This core price indicator measures median inflation changes to help assess medium-term price pressures.
  • CPI m/m: The monthly consumer price report provides a key reading on recent shifts in consumer price momentum.
  • Common CPI y/y: This underlying inflation index assists in tracking persistent broad-based price trends.

Weekly Outlook and Consideration:

EUR/CAD enters the session near 1.60585, constrained below its daily middle Bollinger Band of 1.60855. Technical momentum remains neutral to slightly negative, evidenced by an RSI of 45.99 and a MACD reading of -0.00165. If support at 1.59977 holds firm, price may attempt a recovery toward intermediate resistance at 1.60855 and broader resistance at 1.62683. Conversely, a sustained drop beneath immediate lower bands could expand downward exposure toward support levels depending on upcoming inflation results.

Disclaimer: The analysis provided for EUR/CAD is for informational purposes only and does not constitute investment advice. Traders are encouraged to perform their own analysis and research before making any trading decisions. Market conditions can change quickly, so staying informed with the latest data is essential.
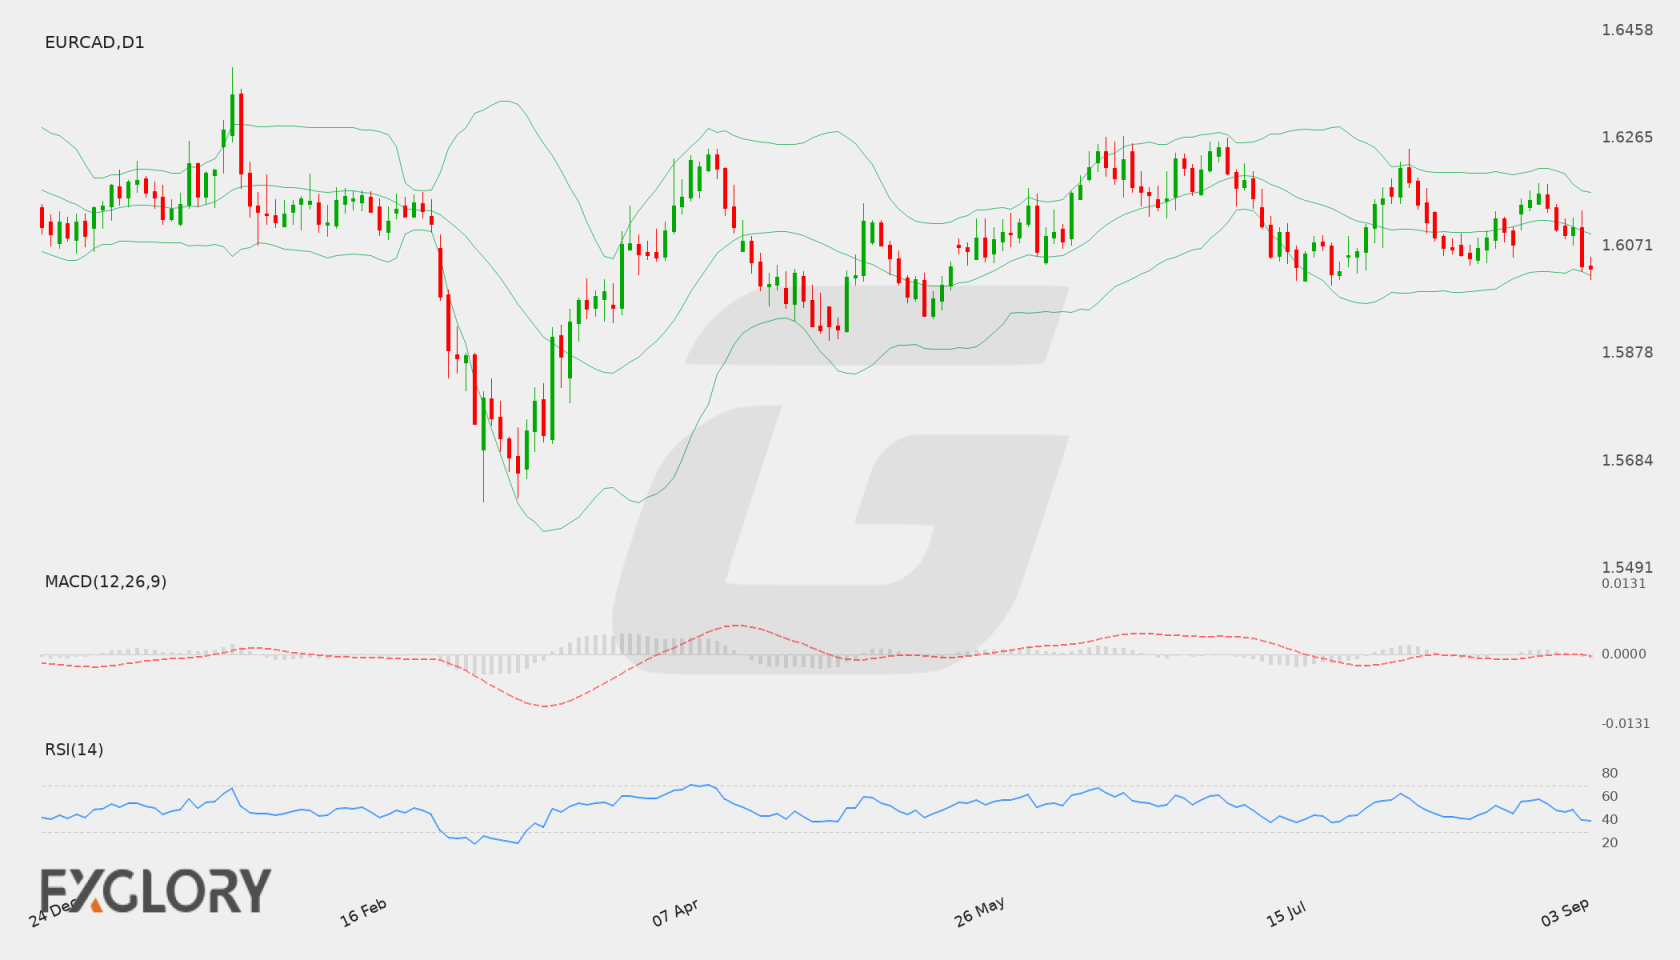
EUR/CAD D1 technical analysis chart
EUR/CAD D1 Technical Analysis for 09.12.2026

EUR/CAD Forecast — 5 September 2026

Time Zone: GMT +3

Time Frame: Daily (D1) / Weekly Outlook

Weekly Fundamental Overview:

EUR/CAD traders face a crucial week driven by key economic announcements from both the euro area and Canada. Monetary policy updates and interest rate decisions from Europe could significantly alter sentiment around the euro, while fiscal announcements from Canada may impact the Canadian dollar.

Price Action:

On the Daily (D1) chart, EUR/CAD has recently moved lower to a last close of 1.60310. The price action demonstrates short-term downward pressure as candles consistently test lower ranges over recent trading sessions.

Key Technical Indicators:

Bollinger Bands: The Bollinger Bands display a middle line at 1.60922, an upper band at 1.61669, and a lower band at 1.60175. The current price of 1.60310 sits near the lower band, reflecting strong downside pressure within the volatility boundary.

RSI: The 14-day Relative Strength Index (RSI) registers at 39.56. This value reflects a weak momentum profile and indicates seller dominance without yet crossing into oversold territory.

MACD: The MACD indicator is currently at -0.00103, residing in negative territory. This negative value aligns with the ongoing bearish momentum seen in recent daily candle closes.

Support and Resistance:

Key Daily technical parameters place immediate support at 1.60006 and primary resistance at 1.62683.

News to Watch for EURCAD This Week:

  • Annual Budget Release: Details on fiscal policy and spending plans may influence sentiment surrounding the Canadian economy.
  • Monetary Policy Statement: Offers critical commentary regarding European economic policy and overall monetary stance.
  • Main Refinancing Rate: Signals official interest rate benchmarks that directly impact valuation for the euro.
  • ECB Press Conference: Delivers forward-looking commentary on economic growth and future policy directions.

Weekly Outlook and Consideration:

EUR/CAD enters the session with a bearish tilt on the D1 timeframe, trading at 1.60310 near support at 1.60006. Technical indicators, including an RSI of 39.56 and a negative MACD, confirm soft short-term momentum. A sustained push below 1.60006 could open the way for additional downward movement, whereas a recovery would need to push past the middle Bollinger Band at 1.60922 toward resistance at 1.62683 to shift the bias.

Disclaimer: The analysis provided for EUR/CAD is for informational purposes only and does not constitute investment advice. Traders are encouraged to perform their own analysis and research before making any trading decisions. Market conditions can change quickly, so staying informed with the latest data is essential.
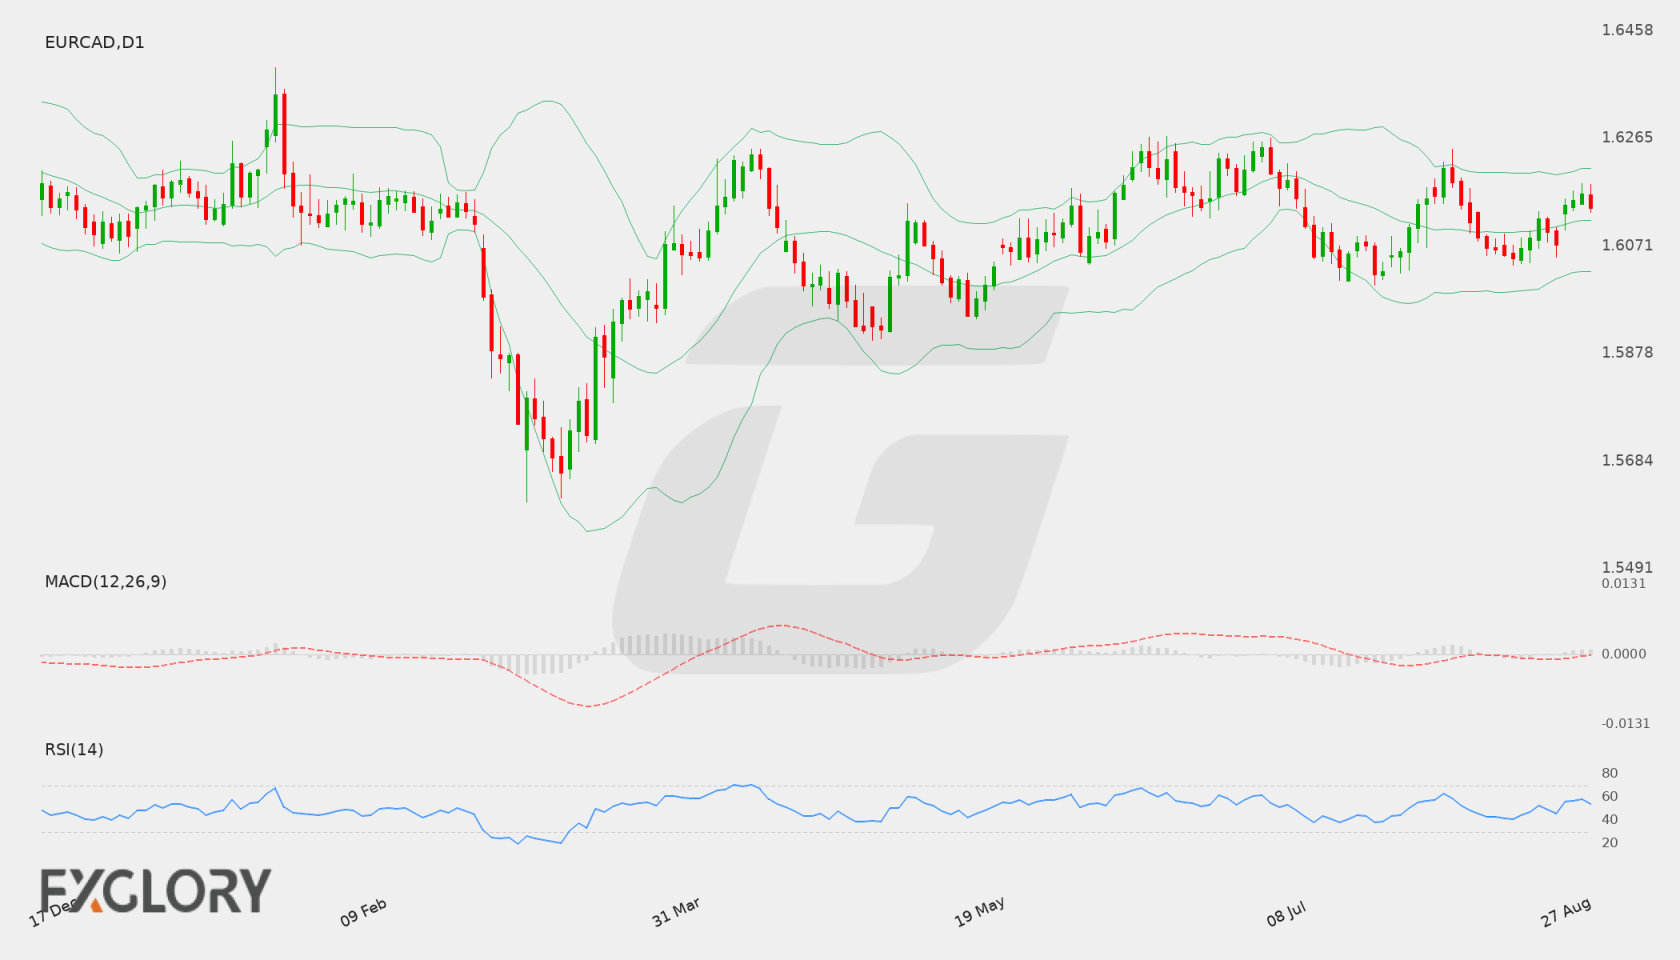
EUR/CAD D1 technical analysis chart
EUR/CAD D1 Technical Analysis for 09.05.2026

EUR/CAD Forecast — 29 August 2026

Time Zone: GMT +3

Time Frame: Daily (D1) / Weekly Outlook

Weekly Fundamental Overview:

The EUR/CAD currency pair enters the trading week influenced by crucial Eurozone inflation data and upcoming Canadian monetary policy decisions. Inflation readings across Europe will help clarify the European Central Bank policy outlook, while the Bank of Canada interest rate decision and domestic employment reports may drive significant volatility for the Canadian dollar. Market participants will be closely monitoring these developments to gauge the relative strength of both currencies.

Price Action:

On the Daily (D1) chart, EUR/CAD recently closed at 1.61394 following a modest pull-back from higher levels. Price action over recent sessions indicates a gradual recovery from lower support zones, with the price consolidating slightly above the middle region of its recent trading range. Buyers are currently trying to maintain control above key short-term moving averages.

Key Technical Indicators:

Bollinger Bands: The Bollinger Bands analysis shows the middle band at 1.61171, with the upper band sitting at 1.62099 and the lower band at 1.60244. EUR/CAD is trading just above the middle band, indicating a mild bullish inclination within a defined volatility corridor, though price remains below the upper boundary.

RSI: The 14-period Relative Strength Index (RSI) is positioned at 54.03. Floating near the neutral 50 level, the RSI reflects balanced market sentiment between buyers and sellers, leaving ample room for movement in either direction before entering extreme territories.

MACD: The MACD indicator is currently reading 0.000597, holding slightly above the zero line. This positive value suggests mild bullish momentum is present, although the modest signal strength points to ongoing consolidation rather than a strong directional surge.

Support and Resistance:

Key technical levels on the D1 timeframe establish primary resistance at 1.62683. On the downside, immediate critical support is located at 1.60006, serving as a primary floor for price action.

News to Watch for EURCAD This Week:

  • German Prelim CPI m/m: Reflects German inflation dynamics that can shift Euro interest rate expectations.
  • CPI Flash Estimate y/y: Measures broader Eurozone headline inflation trends affecting European monetary policy.
  • Core CPI Flash Estimate y/y: Highlights underlying Eurozone price pressures by excluding volatile components.
  • Overnight Rate: Determines short-term Canadian interest rates and directly influences CAD valuation.
  • BOC Rate Statement: Offers official central bank commentary on Canadian economic conditions and policy stance.
  • BOC Press Conference: Provides additional insights into monetary policy deliberations and future interest rate expectations.
  • Employment Change: Tracks job creation in Canada to assess overall labor market performance.
  • Unemployment Rate: Indicates the percentage of unemployed labor force affecting domestic economic policy decisions.

Weekly Outlook and Consideration:

EUR/CAD carries a neutral-to-slightly bullish outlook while holding above 1.61394. If buyers maintain price acceptance above the Bollinger middle band near 1.61171, a retest of the resistance zone at 1.62683 remains possible. Alternatively, a breakdown below the middle band could invite renewed selling pressure toward the main support floor at 1.60006.

Disclaimer: The analysis provided for EUR/CAD is for informational purposes only and does not constitute investment advice. Traders are encouraged to perform their own analysis and research before making any trading decisions. Market conditions can change quickly, so staying informed with the latest data is essential.

EUR/CAD D1 technical analysis chart
EUR/CAD D1 Technical Analysis for 08.29.2026
1EUR = –––CAD –––% ▼
EURCAD
Loading chart...