
EURJPY Forecast

EUR/JPY Forecast — 3 October 2026

Time Zone: GMT +3

Time Frame: Daily (D1) / Weekly Outlook

Weekly Fundamental Overview:

EUR/JPY continues to be influenced by macroeconomic conditions in the Eurozone and Japan, alongside evolving interest rate expectations and sovereign yield differentials. Risk sentiment across global financial markets also remains an essential driver for the Japanese Yen, dictating capital flows across major crosses like EUR/JPY.

Price Action:

On the daily chart, EUR/JPY has displayed sustained selling pressure after declining from previous peaks near 187.457. The pair recorded a sequence of lower daily closes across recent sessions, reaching a low of 176.759 before closing at 177.729. Price action reflects continued bearish control as the market tests lower technical boundaries.

Key Technical Indicators:

Bollinger Bands: The Bollinger Bands show the middle band positioned at 179.280, with the upper band at 181.183 and the lower band at 177.377. With the last close at 177.729, EUR/JPY is trading near the lower band, reflecting strong downside momentum and an expansion in daily volatility.

RSI: The 14-day RSI is currently recorded at 31.49, hovering just above the oversold boundary. While this indicates dominant selling interest in EUR/JPY, it also approaches levels where downward momentum may face exhaustion or consolidation.

MACD: The daily MACD reading stands in negative territory at -1.147. This negative value indicates persistent downward momentum and reflects a continuation of bearish strength across recent daily trading sessions.

Support and Resistance:

Technical support for EUR/JPY is identified at 176.759, which aligns with the recent daily low. Major resistance is positioned at 187.457, with the 20-day middle Bollinger band at 179.280 serving as an intermediate barrier to any upward recovery.

News to Watch for EURJPY This Week:

  • No specific events are available; traders should monitor generic high-impact releases, central bank comments, and broader risk sentiment.

Weekly Outlook and Consideration:

EUR/JPY heads into the week under clear daily downward pressure, having closed at 177.729 close to the lower Bollinger band at 177.377. The MACD value of -1.147 and RSI at 31.49 confirm that bears remain in control. A sustained violation below support at 176.759 could open the door for deeper weakness, whereas any corrective rebound would need to overcome the middle Bollinger band at 179.280 to neutralize immediate selling pressure ahead of the major resistance at 187.457.

Disclaimer: The analysis provided for EUR/JPY is for informational purposes only and does not constitute investment advice. Traders are encouraged to perform their own analysis and research before making any trading decisions. Market conditions can change quickly, so staying informed with the latest data is essential.
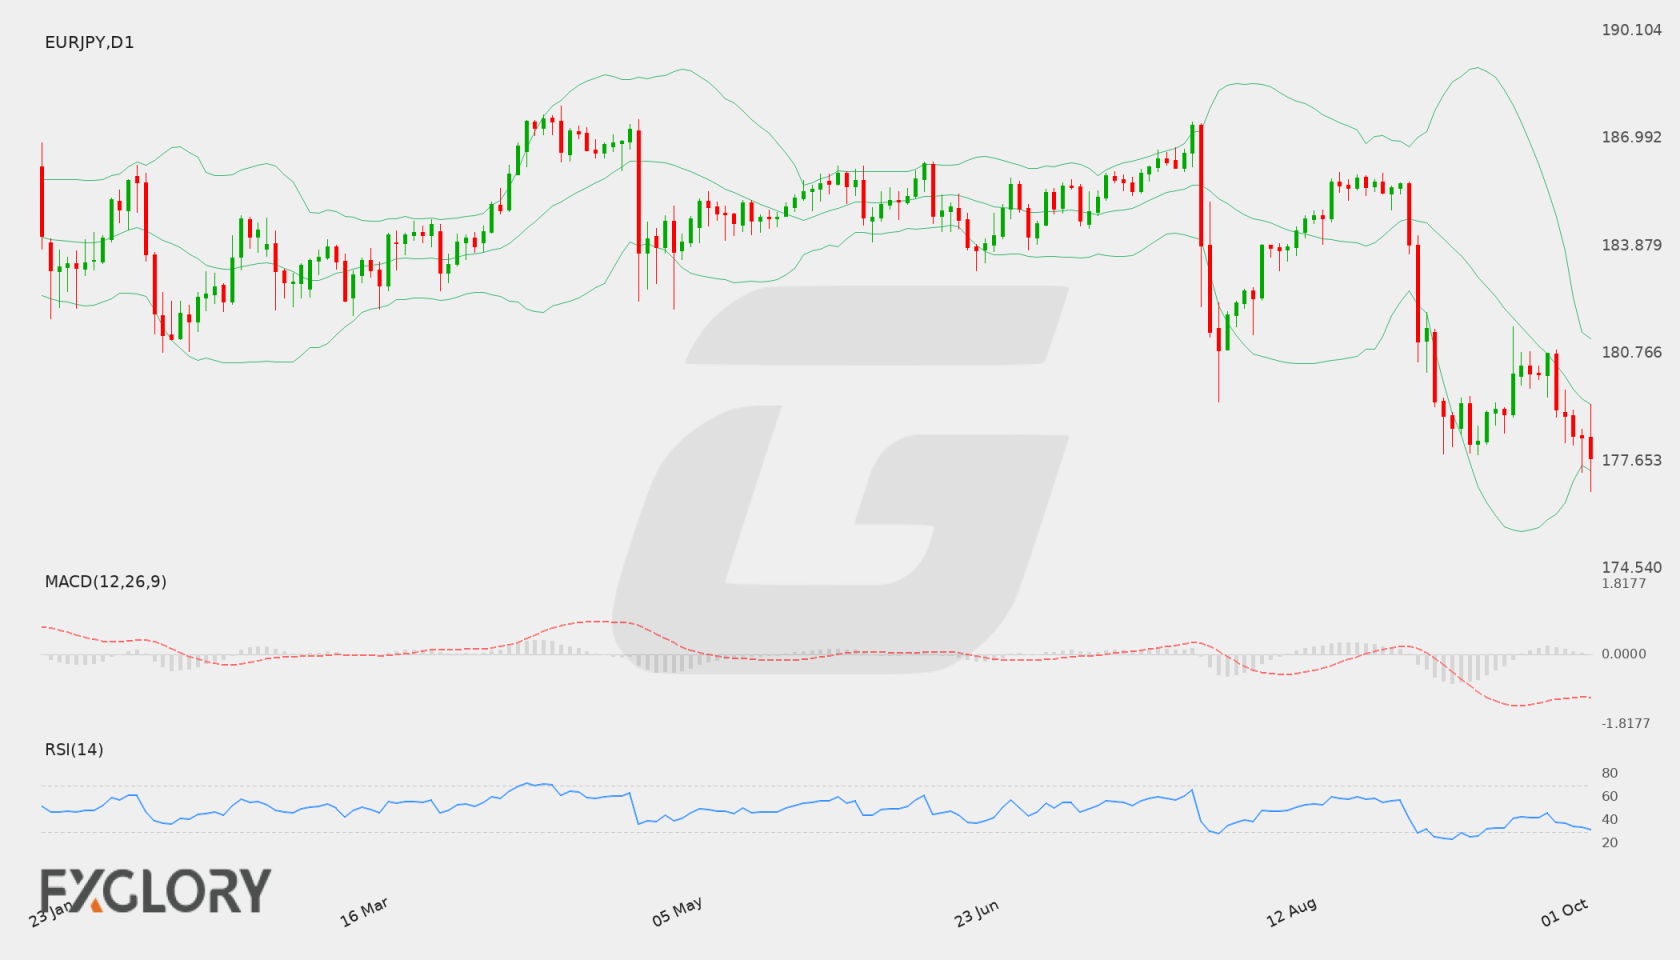
EUR/JPY D1 technical analysis chart
EUR/JPY D1 Technical Analysis for 10.03.2026

EUR/JPY Forecast — 27 September 2026

Time Zone: GMT +3

Time Frame: Daily (D1) / Weekly Outlook

Weekly Fundamental Overview:

The EUR/JPY currency pair reflects ongoing shifts between Eurozone inflation metrics and broader market risk sentiment influencing the Japanese Yen. Traded around 180.775, EURJPY reacts to regional economic indicators as well as monetary policy expectations. Traders continue to monitor incoming macroeconomic data to gauge potential momentum.

Price Action:

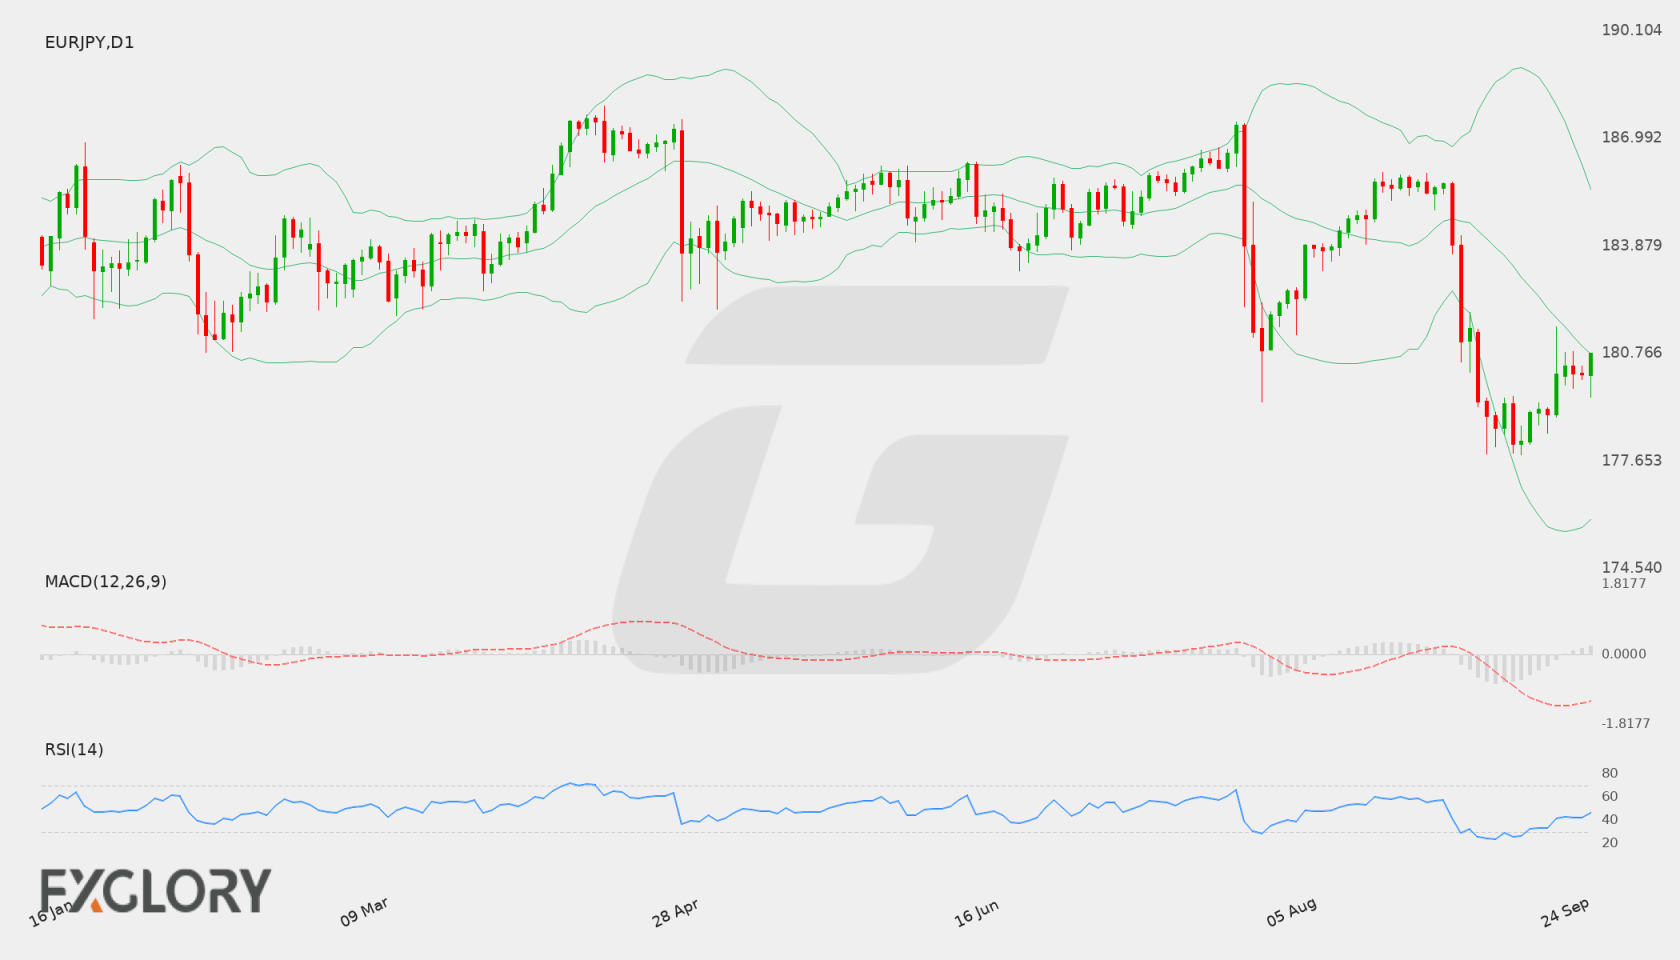
On the Daily (D1) chart, EUR/JPY recently recovered from multi-session lows around the 177.835 region to achieve a close of 180.775. After declining from resistance near 187.457, recent candles indicate a stabilization phase near the midpoint of the recent swing.

Key Technical Indicators:

Bollinger Bands: The Daily Bollinger Bands display a middle band at 180.736, an upper band at 185.518, and a lower band at 175.954. With EURJPY closing at 180.775, price sits virtually on top of the middle band, reflecting a balanced, consolidation stance.

RSI: The 14-period Relative Strength Index (RSI) is currently reading 46.45. Situated in neutral territory below 50, the index reflects an absence of extreme overbought or oversold pressure.

MACD: The Daily MACD indicator stands at -0.995. The negative value indicates residual bearish momentum from the earlier sell-off, although flat price action near 180.775 suggests diminishing downward impulse.

Support and Resistance:

Key technical support for EUR/JPY is established at 177.835, which effectively contained recent downside attempts. Overhead resistance is identified at 187.457, defining the upper bound of the major daily price structure.

News to Watch for EURJPY This Week:

  • German Prelim CPI m/m: Inflation figures from Germany offer critical guidance on broader European price stability and can impact Euro sentiment.

Weekly Outlook and Consideration:

EUR/JPY displays a consolidating weekly outlook following a bounce from support at 177.835 toward 180.775. Positioned close to the Bollinger middle band of 180.736 with an RSI of 46.45, the pair may remain bound within the broader range capped by resistance at 187.457 until a breakout occurs.

Disclaimer: The analysis provided for EUR/JPY is for informational purposes only and does not constitute investment advice. Traders are encouraged to perform their own analysis and research before making any trading decisions. Market conditions can change quickly, so staying informed with the latest data is essential.
EUR/JPY D1 technical analysis chart
EUR/JPY D1 Technical Analysis for 09.27.2026

EUR/JPY Forecast — 20 September 2026

Time Zone: GMT +3

Time Frame: Daily (D1) / Weekly Outlook

Weekly Fundamental Overview:

The EUR/JPY currency pair reflects ongoing interplay between Eurozone economic performance and Japanese monetary dynamics. Recent market conditions have highlighted shifting rate expectations and inflation trajectory, keeping market participants focused on key upcoming inflation data releases across Europe and Japan. General risk sentiment across global markets continues to play a significant role in dictating the direction of this cross rate.

Price Action:

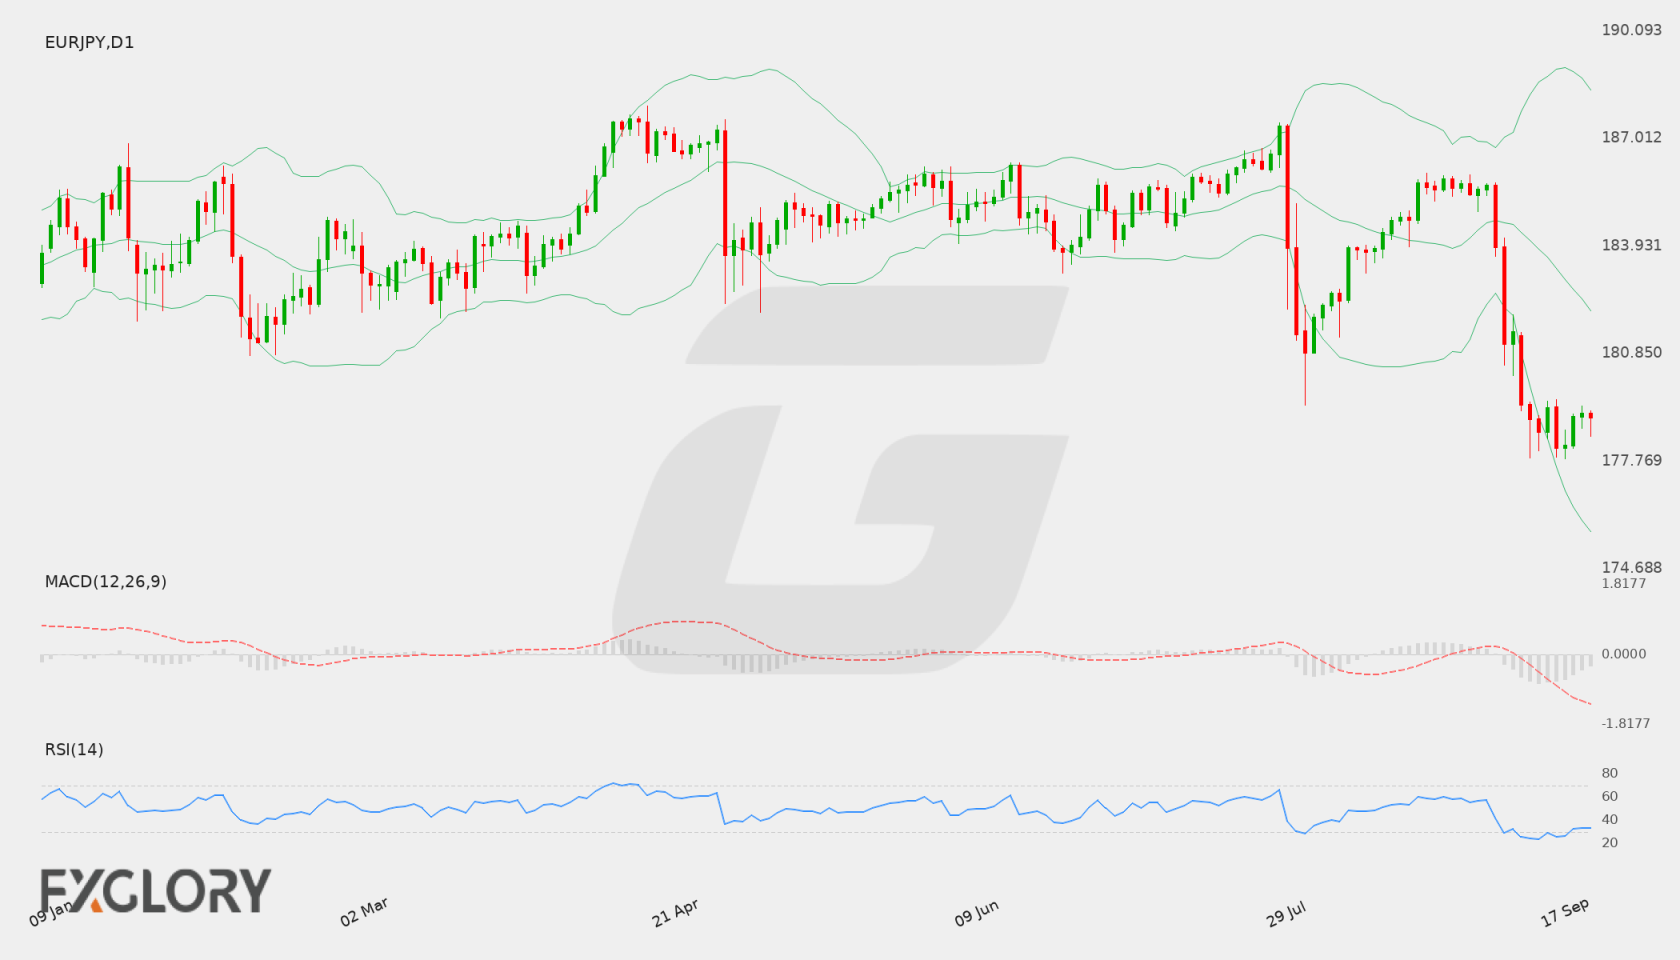
On the Daily (D1) chart, EUR/JPY has displayed a clear corrective trajectory, pushing down from recent swing highs to record a last close of 179.012. The series of lower daily closes demonstrates sustained selling pressure over recent sessions, though price action has shown signs of short-term stabilization just above key downside technical levels.

Key Technical Indicators:

Bollinger Bands: The D1 Bollinger Bands show a middle band at 182.069, an upper band at 188.387, and a lower band at 175.751. Trading at 179.012, EUR/JPY remains positioned in the lower half of the band structure below the 182.069 moving average, indicating persistent bearish pressure relative to its recent volatility range.

RSI: The 14-period RSI currently stands at 32.86. Operating close to the oversold boundary of 30, this reading reflects strong downward momentum while also warning that the selling wave may be approaching stretched technical territory.

MACD: The Daily MACD indicator prints a reading of -1.6026. This negative value beneath the signal line confirms that short-term momentum remains firmly under bearish control, with no clear bullish crossover established on the daily timeframe.

Support and Resistance:

Key technical reference points on the D1 chart feature immediate support around 177.835, which served as a recent floor. On the upside, main resistance is identified at 187.457, with the Bollinger middle band near 182.069 acting as an intermediate resistance level during any counter-trend recovery.

News to Watch for EURJPY This Week:

  • German Prelim CPI m/m: Tracks preliminary inflation shifts in Germany, offering early indications of wider Eurozone price pressures.
  • Tokyo Core CPI y/y: Evaluates underlying consumer price inflation in Tokyo, influencing expectations regarding Japanese monetary policy.
  • CPI Flash Estimate y/y: Reflects overall Eurozone consumer inflation figures, potentially driving price volatility for the Euro.

Weekly Outlook and Consideration:

EUR/JPY enters the upcoming trading week with a predominantly bearish stance on the daily chart, holding at 179.012. Technical indicators remain subdued, with MACD deep in negative territory at -1.6026 and RSI depressed at 32.86. Should price weakness persist, testing support at 177.835 remains a possibility. Conversely, any short-term retracement will likely encounter resistance near the 182.069 middle band before challenging upper resistance at 187.457. Market participants should monitor incoming European and Japanese inflation data for potential volatility catalysts.

Disclaimer: The analysis provided for EUR/JPY is for informational purposes only and does not constitute investment advice. Traders are encouraged to perform their own analysis and research before making any trading decisions. Market conditions can change quickly, so staying informed with the latest data is essential.
EUR/JPY D1 technical analysis chart
EUR/JPY D1 Technical Analysis for 09.20.2026

EUR/JPY Forecast — 12 September 2026

Time Zone: GMT +3

Time Frame: Daily (D1) / Weekly Outlook

Weekly Fundamental Overview:

The fundamental context for EUR/JPY is shaped by central bank policy expectations and shifting risk sentiment. Economic announcements from Japan, including interest rate decisions and official statements, remain key focal points that could generate price volatility for the pair. Market participants are monitoring policy commentary to gauge relative strength between the euro and the Japanese yen.

Price Action:

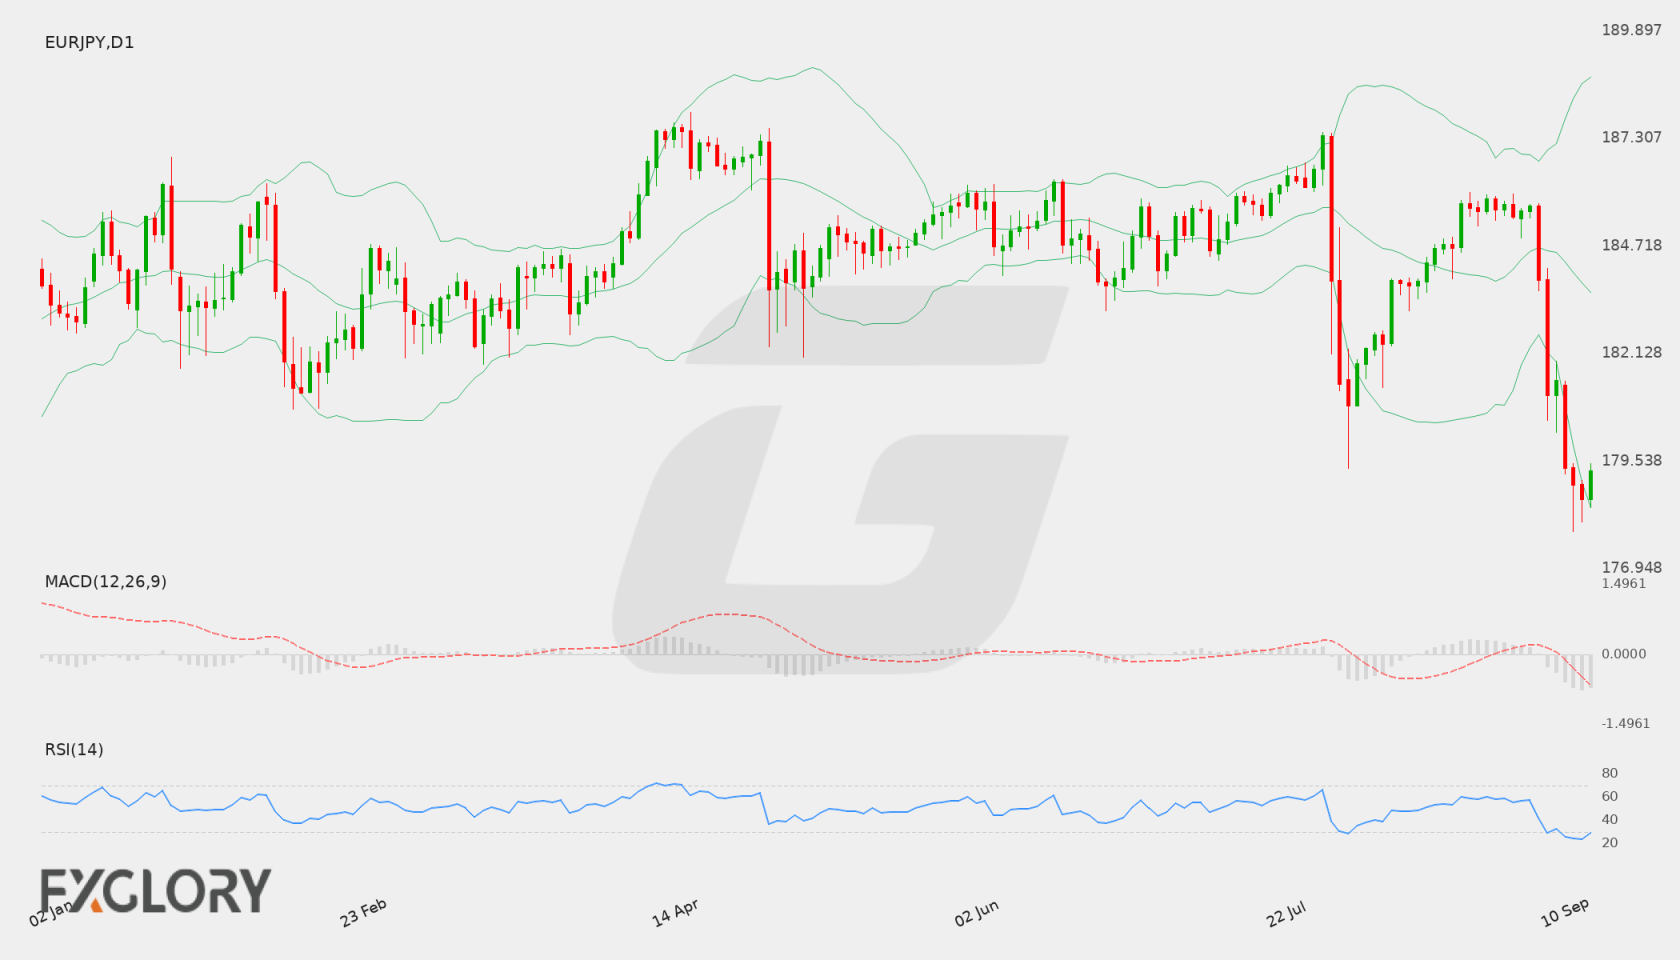
On the daily timeframe, EUR/JPY recently experienced a sharp decline from levels near 185.67 to a low of 177.841 before rebounding slightly to close at 179.306. The rapid downward move reflects significant selling pressure, though the recent bounce off support indicates buyers attempted to stabilize price near lower boundary levels.

Key Technical Indicators:

Bollinger Bands: The daily Bollinger Bands reflect expanding volatility following the strong drop. The middle band sits at 183.597, with the upper band at 188.789 and the lower band at 178.406. EUR/JPY traded close to the lower band at its last close of 179.306, confirming strong bearish price positioning relative to the moving average.

RSI: The 14-day Relative Strength Index (RSI) stands at 29.01. Entering oversold territory indicates that the recent sell-off was aggressive, which may lead to consolidation or a temporary pullback if selling momentum slows.

MACD: The daily MACD indicator displays strong negative momentum, with a reading of -1.36. Trading below the zero line underscores persistent bearish sentiment across recent daily sessions for EUR/JPY.

Support and Resistance:

Key technical levels on the daily chart place immediate support at 177.841, matching recent swing lows. Overhead resistance is identified at 187.457, marking a primary barrier should a broader bullish recovery develop.

News to Watch for EURJPY This Week:

  • Monetary Policy Statement: Official policy details provide clarity on economic assessments and potential monetary policy shifts.
  • BOJ Press Conference: Executive leadership remarks offer prospective insights regarding future policy decisions and economic outlooks.
  • BOJ Policy Rate: Rate determinations directly impact underlying yield expectations and currency valuation.

Weekly Outlook and Consideration:

The weekly outlook for EUR/JPY highlights a market navigating strong downside pressure toward key support at 177.841. Technical metrics show an oversold RSI of 29.01 alongside a negative MACD of -1.36, while price trades near the lower Bollinger Band of 178.406. Upcoming policy announcements, including the BOJ Policy Rate release, could determine whether support holds or if further directional moves emerge.

Disclaimer: The analysis provided for EUR/JPY is for informational purposes only and does not constitute investment advice. Traders are encouraged to perform their own analysis and research before making any trading decisions. Market conditions can change quickly, so staying informed with the latest data is essential.
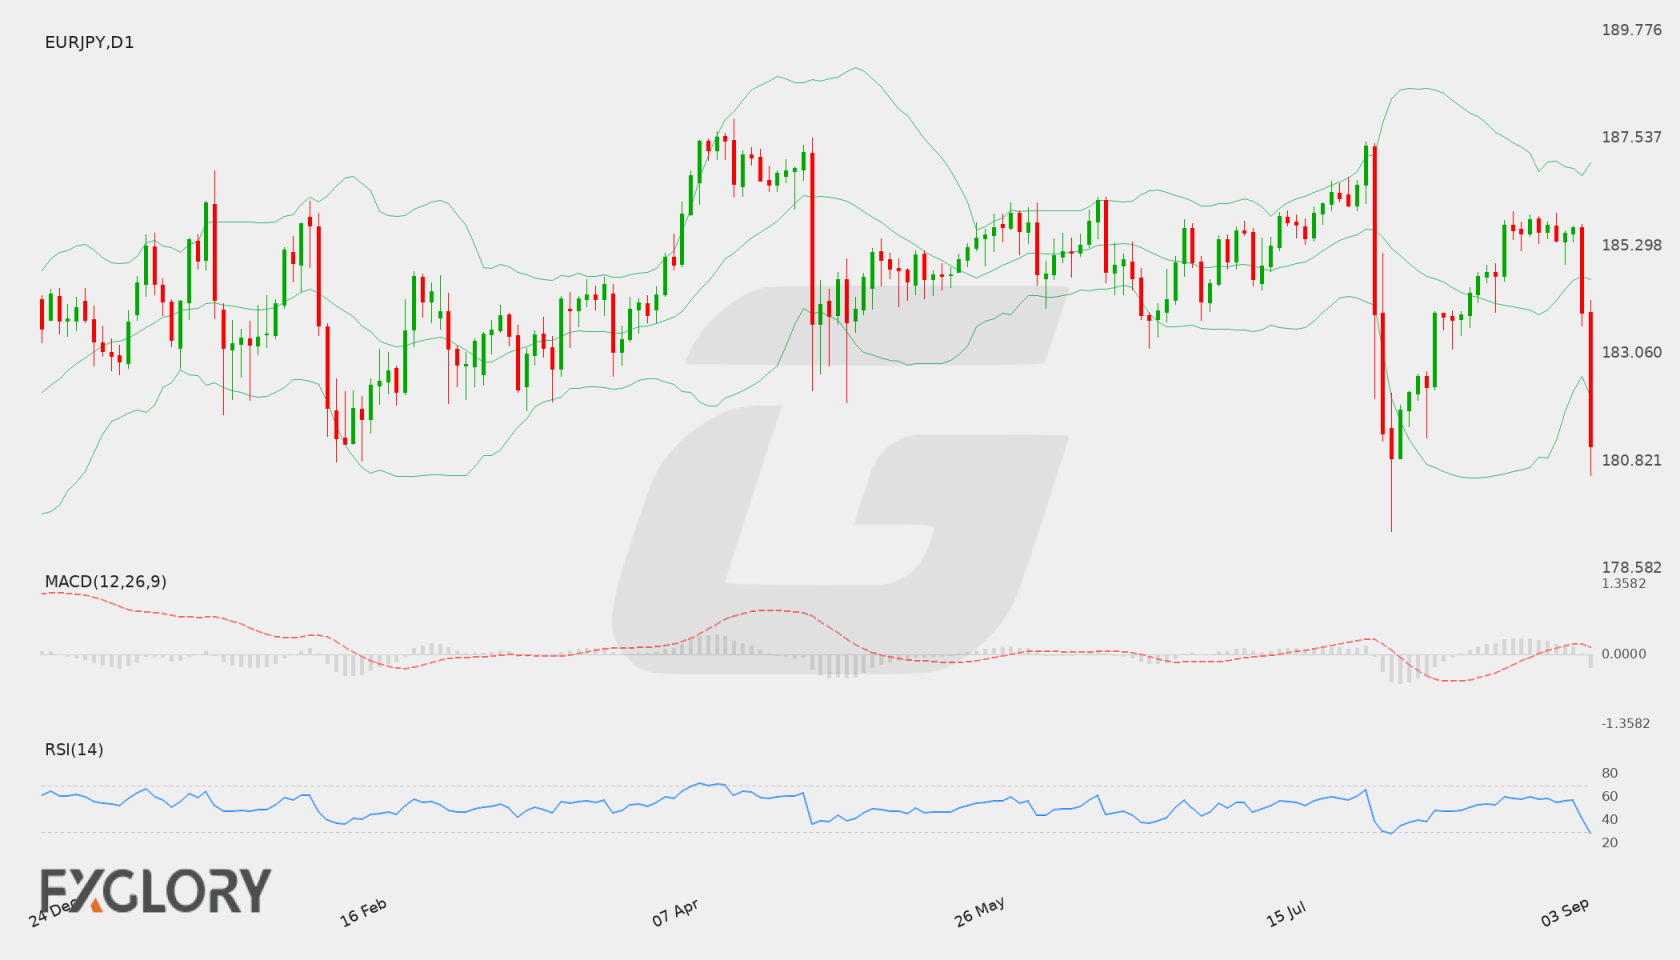
EUR/JPY D1 technical analysis chart
EUR/JPY D1 Technical Analysis for 09.12.2026

EUR/JPY Forecast — 5 September 2026

Time Zone: GMT +3

Time Frame: Daily (D1) / Weekly Outlook

Weekly Fundamental Overview:

EUR/JPY fundamental dynamics remain sensitive to monetary policy expectations from the European Central Bank and shifts in Japanese Yen sentiment. Broad yield differentials and risk appetite continue to influence price movements across the pair as market participants monitor central bank communications for guidance on interest rate trajectories.

Price Action:

On the daily (D1) chart, EUR/JPY experienced notable selling pressure in recent sessions, descending from above 185.60 down past 183.909 to close at 181.129. The sharp drop represents a strong short-term bearish swing, pushing price action beneath recent consolidation areas.

Key Technical Indicators:

Bollinger Bands: The Bollinger Bands display a middle band at 184.595, an upper band at 187.036, and a lower band at 182.154. The latest close at 181.129 rests beneath the lower band, reflecting expanded downside volatility and a potential short-term stretched condition relative to the mean.

RSI: The 14-period Relative Strength Index (RSI) registers at 29.18, sliding into oversold territory below the 30 threshold. While this underscores strong selling momentum, it also suggests the potential for seller fatigue or corrective pauses.

MACD: The MACD indicator prints at -0.123, remaining in negative territory to reflect active bearish momentum on the daily timeframe following recent downside price movements.

Support and Resistance:

Key technical levels for EUR/JPY feature immediate support near 179.354, with major resistance situated around 187.457. Dynamic resistance sits near the middle Bollinger Band around 184.595.

News to Watch for EURJPY This Week:

  • Monetary Policy Statement: This statement outlines the central bank monetary policy stance and can significantly influence euro exchange rates.
  • Main Refinancing Rate: The benchmark interest rate decision directly impacts borrowing costs and euro sentiment.
  • ECB Press Conference: Live central bank commentary offers crucial insights into future policy direction and economic expectations.

Weekly Outlook and Consideration:

EUR/JPY enters the new week under solid bearish momentum after closing at 181.129. With the daily RSI in oversold territory at 29.18 and price trading below the lower Bollinger Band of 182.154, the pair shows strong downside pressure, though a minor rebound toward the 184.595 middle band remains possible if profit-taking emerges. Continued downside traction could lead to a retest of the key support level near 179.354, whereas any significant recovery will encounter resistance toward 187.457.

Disclaimer: The analysis provided for EUR/JPY is for informational purposes only and does not constitute investment advice. Traders are encouraged to perform their own analysis and research before making any trading decisions. Market conditions can change quickly, so staying informed with the latest data is essential.

EUR/JPY D1 technical analysis chart
EUR/JPY D1 Technical Analysis for 09.05.2026
1EUR = –––JPY –––% ▼
EURJPY
Loading chart...