Time Zone: GMT +3
Time Frame: Daily (D1) / Weekly Outlook
Weekly Fundamental Overview:
Silver (SILVER) remains sensitive to broad macroeconomic dynamics, industrial demand forecasts, and upcoming economic releases. Upcoming data reports evaluating manufacturing strength and labor market conditions could significantly influence investor sentiment and price behavior for the metal.
Price Action:
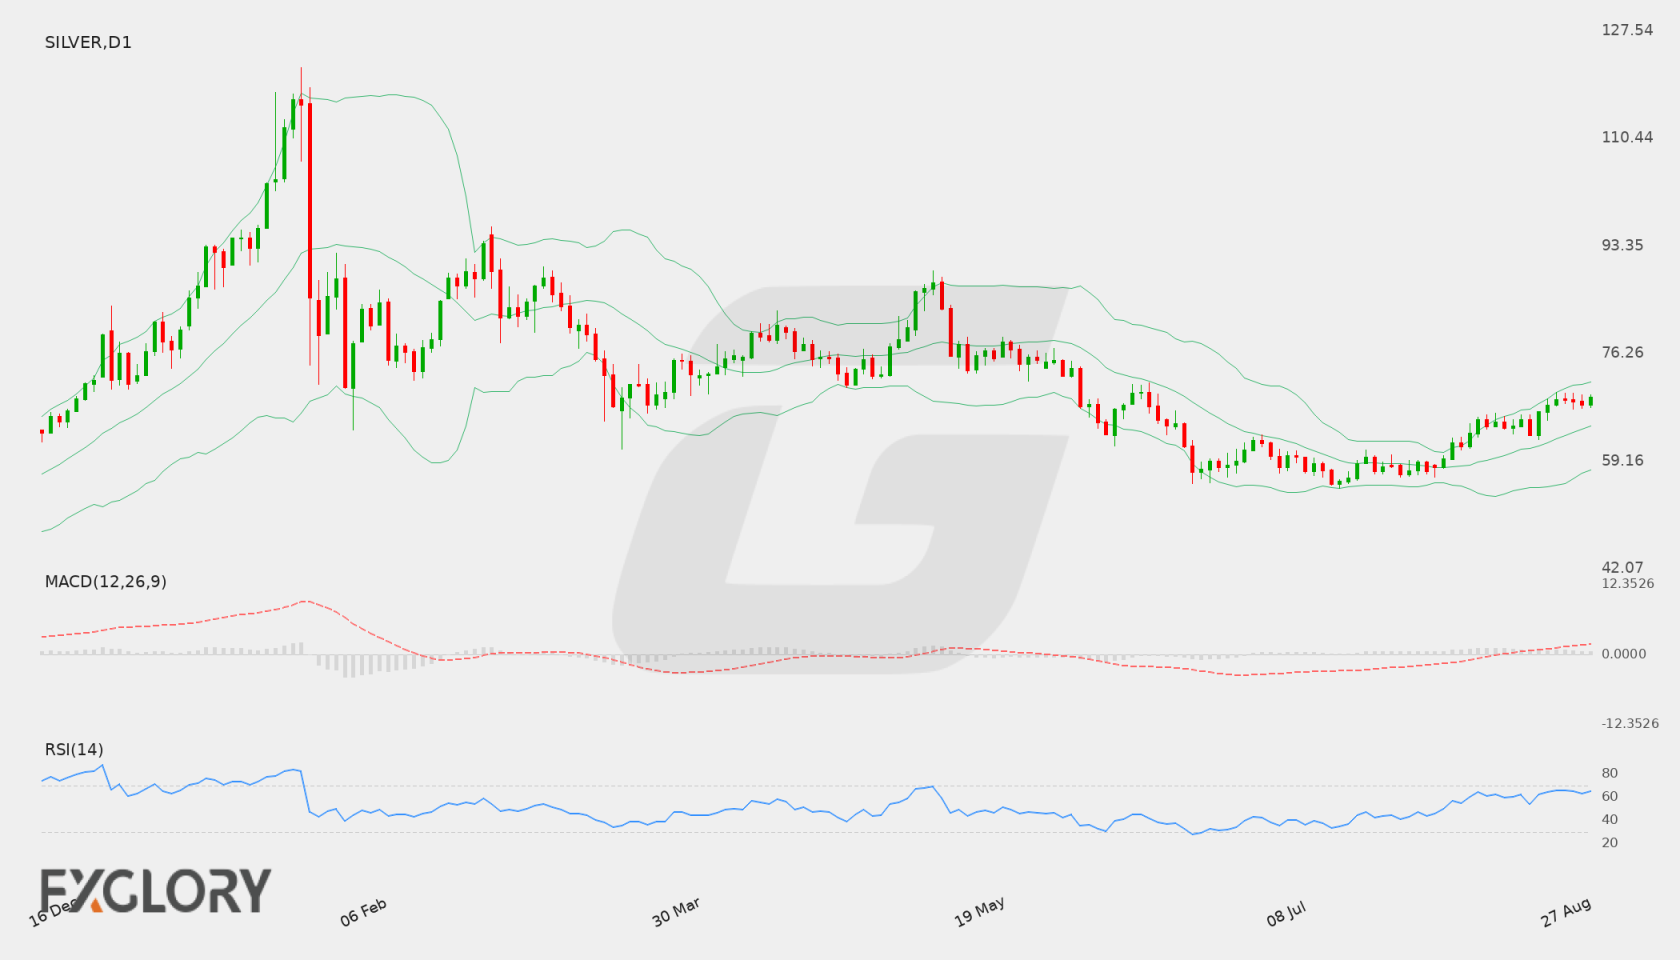
Daily chart analysis shows Silver (SILVER) building positive momentum over recent trading sessions, rising from recent pullbacks to close at 69.249. The succession of higher daily closes indicates an ongoing attempt to test higher price boundaries.
Key Technical Indicators:
Bollinger Bands: The daily Bollinger Bands place the Middle Band at 64.758, the Upper Band at 71.745, and the Lower Band at 57.771. Silver (SILVER) currently trades at 69.249, positioned in the upper portion of the band structure above the median line.
RSI: The 14-period Relative Strength Index (RSI) registers at 65.109. This reading indicates firm bullish sentiment for Silver (SILVER) while maintaining space below overbought conditions.
MACD: The MACD indicator is currently reading 2.176, remaining above the zero baseline. This positive value reflects active upward momentum on the daily timeframe for Silver (SILVER).
Support and Resistance:
Key technical benchmarks on the daily chart identify main support at 54.757 and key resistance at 74.112. The middle Bollinger Band around 64.758 also serves as an intermediate level of support.
News to Watch for SILVER This Week:
- ISM Manufacturing PMI: Reflects the strength of manufacturing activity which can influence market sentiment toward industrial metals.
- JOLTS Job Openings: Indicates labor market demand and broader economic health.
- ISM Manufacturing Prices: Tracks price changes paid by manufacturers to measure inflationary trends.
- ADP Non-Farm Employment Change: Serves as an early gauge of private sector employment dynamics.
- ISM Services PMI: Evaluates activity levels across the service sector to gauge general economic expansion.
- Non-Farm Employment Change: Provides key non-farm employment totals that heavily impact overall market volatility.
- Unemployment Rate: Shows the percentage of the unemployed workforce as a measure of labor market stability.
- Average Hourly Earnings m/m: Measures changes in labor costs and wage inflation trends.
Weekly Outlook and Consideration:
Silver (SILVER) maintains a positive technical structure on the daily chart, holding a last close of 69.249 above the middle Bollinger Band of 64.758. With an RSI of 65.109 and a positive MACD of 2.176, technical indicators suggest upward momentum. Market participants will watch whether prices move toward resistance at 74.112 or retracements approach support at 54.757 during the release of upcoming macroeconomic data.
Disclaimer: The analysis provided for Silver is for informational purposes only and does not constitute investment advice. Traders are encouraged to perform their own analysis and research before making any trading decisions. Market conditions can change quickly, so staying informed with the latest data is essential.