Time Zone: GMT +3
Time Frame: Daily (D1) / Weekly Outlook
Weekly Fundamental Overview:
Gold (GOLD) is navigating market attention focused on upcoming macroeconomic data releases and economic health indicators that directly influence demand for precious metals. Market participants continue to evaluate broader economic conditions, monetary sentiment, and labor market metrics to assess the asset’s directional strength.
Price Action:
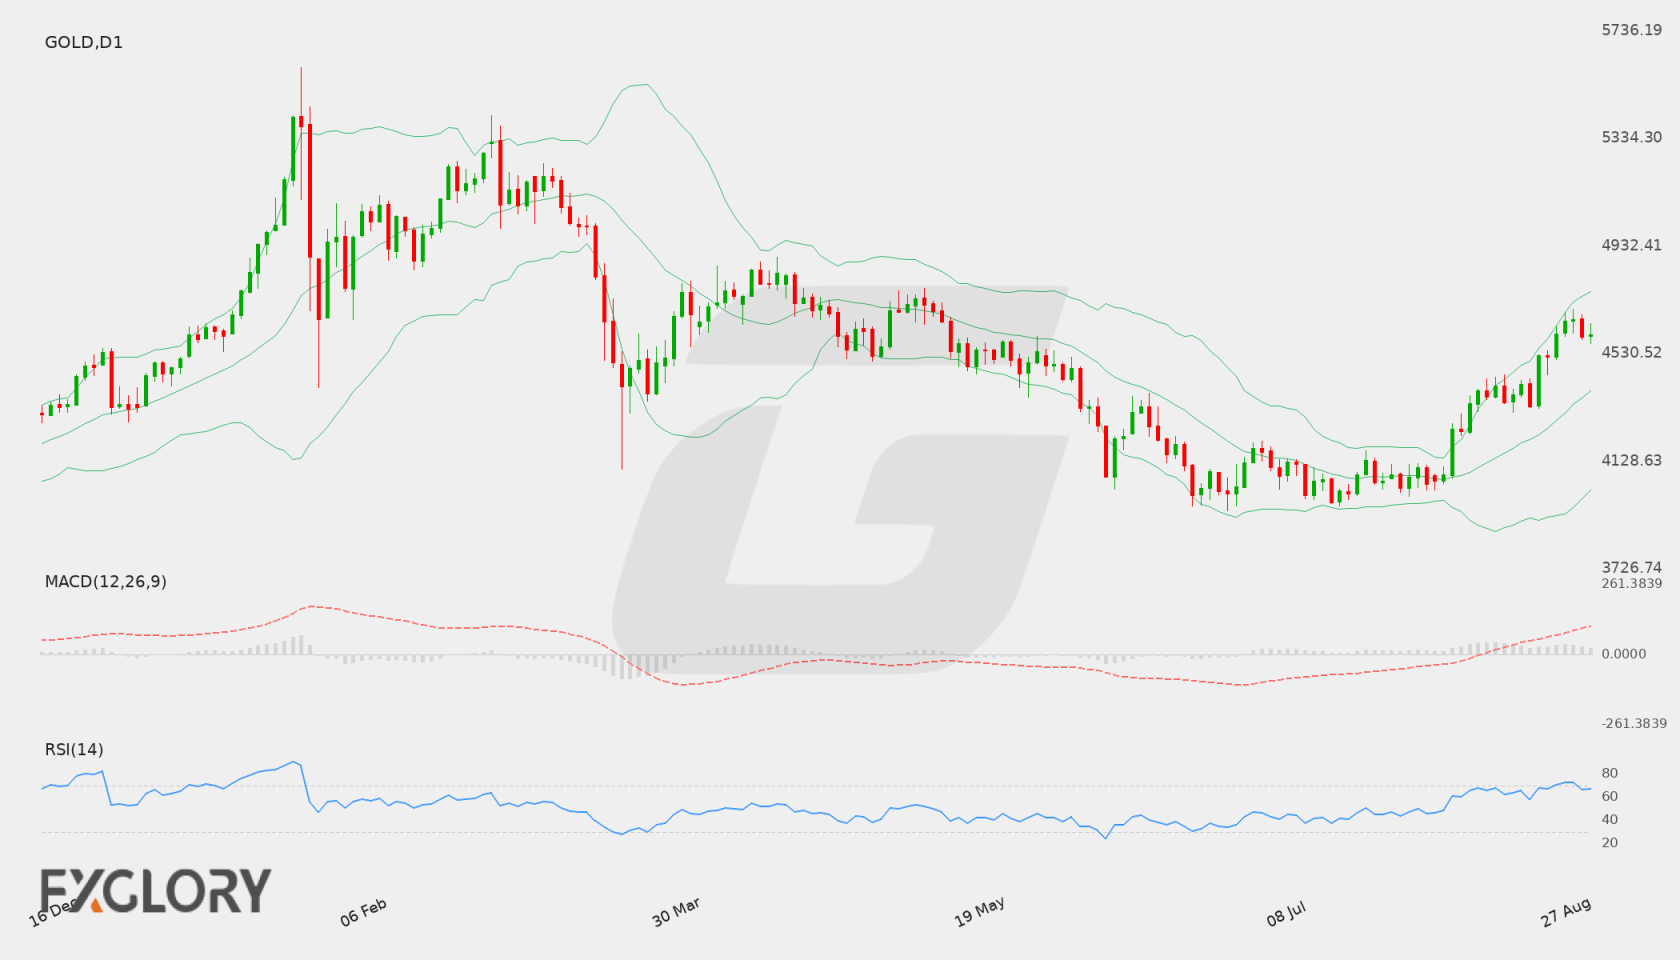
On the Daily (D1) chart, Gold (GOLD) closed at 4600.9 after making a move toward higher levels. The recent chart pattern demonstrates a steady upward trend from mid-range levels around 4054.89, with price action consolidating near the recent peak below resistance.
Key Technical Indicators:
Bollinger Bands: The daily Bollinger Bands reveal a middle band at 4389.85, an upper band at 4760.58, and a lower band at 4019.12. Trading near the upper band reflects strong positive price momentum for Gold (GOLD) over recent sessions.
RSI: The 14-period RSI stands at 66.71, indicating a strong bullish sentiment while trading just beneath overbought territory.
MACD: The MACD indicator is currently situated at 124.83, indicating positive momentum and continuing upward momentum on the Daily timeframe for Gold (GOLD).
Support and Resistance:
Key technical benchmarks for Gold (GOLD) feature technical support at 3943.33 and overhead resistance at 4696.65.
News to Watch for GOLD This Week:
- ISM Manufacturing PMI: Offers valuable insights into manufacturing sector expansion or contraction, influencing broader risk appetite.
- JOLTS Job Openings: Provides a measure of labor demand and job availability that can shift economic expectations.
- ISM Manufacturing Prices: Signals price trends in the manufacturing domain, offering insight into inflationary pressures.
- ADP Non-Farm Employment Change: Provides an early look at private payroll growth and labor market momentum.
- ISM Services PMI: Evaluates conditions in the services sector to gauge broader business strength.
- Non-Farm Employment Change: Delivers crucial data on national job creation that often drives significant price movement.
- Unemployment Rate: Details the percentage of the labor force without work, reflecting overall economic resilience.
- Average Hourly Earnings m/m: Reflects wage growth pressures, which are vital for assessing inflation dynamics.
Weekly Outlook and Consideration:
Gold (GOLD) displays a construct bullish structure, backed by a positive MACD of 124.83 and an RSI reading of 66.71. Holding above the middle Bollinger band at 4389.85, the price remains positioned near key resistance at 4696.65. A sustained move above resistance could see test of upper Bollinger levels near 4760.58, while a corrective move lower may bring the technical support level at 3943.33 or the lower Bollinger band near 4019.12 back into play. Traders will watch high-impact labor and economic releases closely for further volatility.
Disclaimer: The analysis provided for Gold is for informational purposes only and does not constitute investment advice. Traders are encouraged to perform their own analysis and research before making any trading decisions. Market conditions can change quickly, so staying informed with the latest data is essential.