Time Zone: GMT +3
Time Frame: Daily (D1) / Weekly Outlook
Weekly Fundamental Overview:
USD/ZAR price dynamics remain tied to global risk sentiment and economic data trends affecting the US Dollar. Traders are closely tracking domestic inflation updates and growth figures alongside US economic indicators to evaluate potential monetary policy trajectories. The combination of evolving interest rate expectations and broader emerging market currency trends plays a significant role in guiding the pair’s overall momentum.
Price Action:
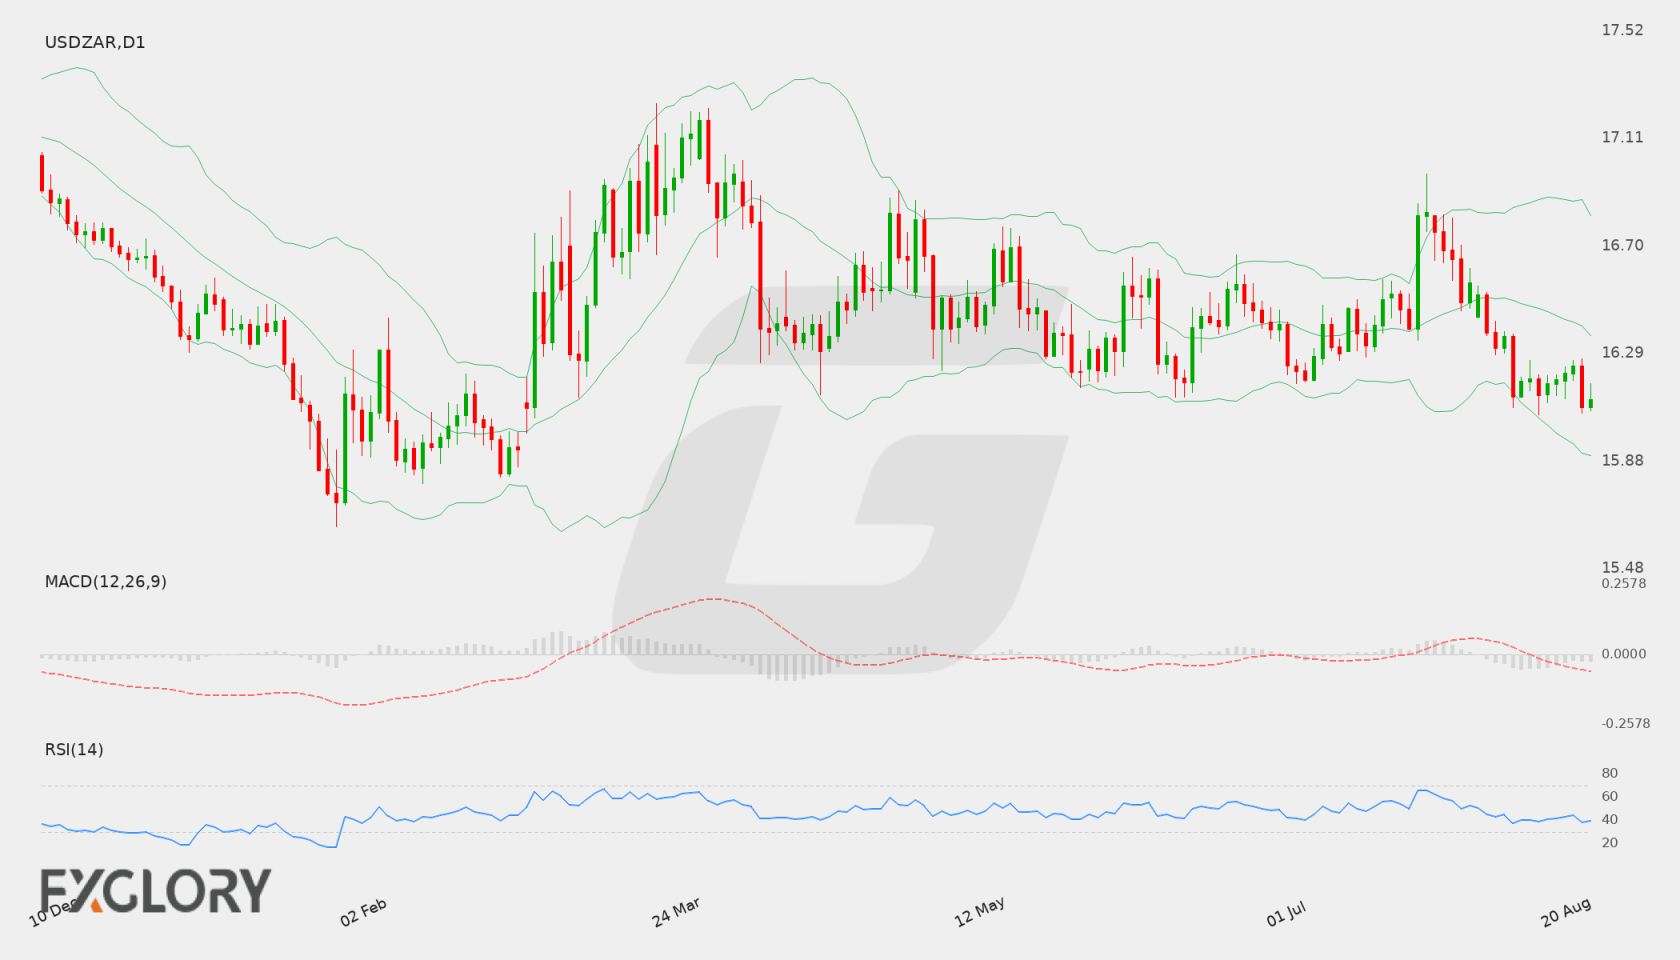
The daily chart for USD/ZAR shows the pair closing at 16.11625 after opening at 16.08951, hitting a high of 16.17879 and a low of 16.07499. Recent daily candles demonstrate a slight consolidation near recent lows, remaining positioned below the mid-point of the recent trading range as sellers maintain a degree of control.
Key Technical Indicators:
Bollinger Bands: USD/ZAR trades below the Bollinger middle band of 16.36088, reflecting a sustained downward bias. The upper band is established at 16.81579, while the lower band sits at 15.90597. The location of the current price near 16.11625 suggests price action is skewed toward the lower boundary of the volatility band.
RSI: The 14-day Relative Strength Index (RSI) is currently reading 39.55. Positioned below the 50 neutral mark, it highlights prevailing selling pressure while remaining above oversold territory.
MACD: The MACD indicator on the D1 chart records a negative value of -0.08674. This negative alignment indicates ongoing bearish momentum for USD/ZAR without immediate signs of a bullish crossover.
Support and Resistance:
Daily technical analysis identifies key technical levels for USD/ZAR, with immediate support located at 16.05893 and primary resistance situated at 16.97254.
News to Watch for USDZAR This Week:
- CB Consumer Confidence: Reflects consumer sentiment regarding economic conditions and future financial expectations.
- Core PCE Price Index m/m: Measures underlying inflation changes affecting federal monetary policy considerations.
- Prelim GDP q/q: Offers updated quarterly growth data reflecting overall economic performance.
- Prelim GDP Price Index q/q: Evaluates inflation rates within output calculations to highlight price stability.
- Unemployment Claims: Offers weekly data on initial jobless filings to monitor labor market health.
- Prelim Benchmark Payrolls Revision: Re-evaluates historical job growth estimates to refine national employment trends.
Weekly Outlook and Consideration:
The weekly outlook for USD/ZAR leans cautious-to-bearish as price action stays constrained below the middle Bollinger band of 16.36088. With the D1 MACD at -0.08674 and the RSI at 39.55, momentum favours sellers toward the key support level at 16.05893. A sustained breakdown below this support could expose lower levels near the lower Bollinger band at 15.90597. Conversely, any technical recovery will need to surpass middle band resistance before attempting a move toward the main resistance at 16.97254. High-impact US data releases during the week are expected to drive additional market volatility.
Disclaimer: The analysis provided for USD/ZAR is for informational purposes only and does not constitute investment advice. Traders are encouraged to perform their own analysis and research before making any trading decisions. Market conditions can change quickly, so staying informed with the latest data is essential.