Time Zone: GMT +3
Time Frame: Daily (D1) / Weekly Outlook
Weekly Fundamental Overview:
The GBP/JPY pair reflects ongoing interactions between UK economic developments and Japanese yen risk dynamics. Market participants evaluate central bank stance expectations and risk appetite, as shifting yield differentials continue to guide medium-term flows across the currency pair.
Price Action:
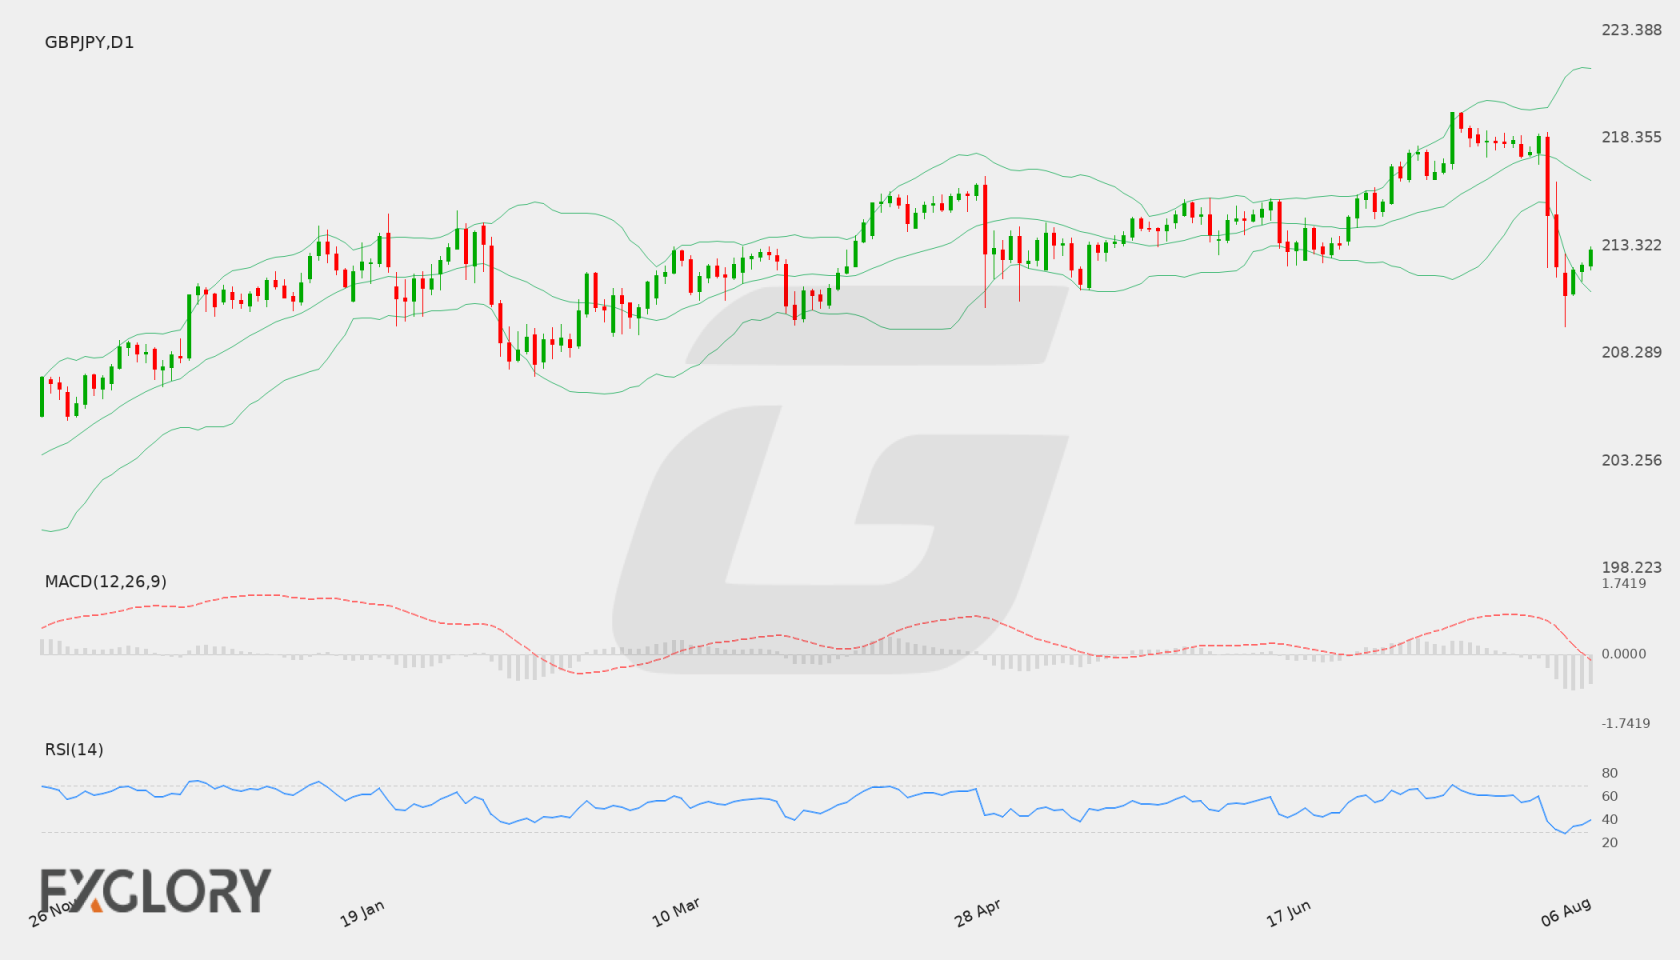
On the daily (D1) chart, GBP/JPY recently experienced a notable decline from recent highs near resistance, reaching a low near the 209.539 support level before steadying. The pair subsequently recovered toward the latest close of 213.143, attempting to consolidate after the recent selling pressure.
Key Technical Indicators:
Bollinger Bands: The daily Bollinger Bands show a middle band at 216.398, an upper band at 221.618, and a lower band at 211.179. GBP/JPY trades at 213.143, hovering between the lower and middle bands following a test of lower boundary areas.
RSI: The 14-period Relative Strength Index (RSI) is currently reading 39.74. This places the oscillator in cooler territory below the neutral 50 level, though it remains above oversold conditions.
MACD: The MACD indicator stands at -0.881, remaining below the zero line to reflect lingering bearish momentum after the recent sell-off from higher price zones.
Support and Resistance:
Key technical levels on the daily timeframe establish primary support at 209.539 and primary resistance at 219.582. The middle Bollinger band near 216.398 serves as an intermediate resistance level on potential upward corrections.
News to Watch for GBPJPY This Week:
- Claimant Count Change: This indicator reflects shifts in employment demand and can sway economic sentiment around the British Pound.
- Average Earnings Index 3m/y: Tracks wage growth trends in the UK, offering clues regarding underlying inflationary pressures and monetary policy expectations.
Weekly Outlook and Consideration:
The weekly outlook for GBP/JPY highlights a market navigating recovery efforts following a sharp pullback toward support at 209.539. With price action currently at 213.143, below the middle Bollinger band of 216.398, a sustained move higher would need to clear intermediate technical hurdles to challenge resistance at 219.582. Conversely, failure to hold above recent session lows could renew downward pressure toward key support at 209.539.
Disclaimer: The analysis provided for GBP/JPY is for informational purposes only and does not constitute investment advice. Traders are encouraged to perform their own analysis and research before making any trading decisions. Market conditions can change quickly, so staying informed with the latest data is essential.