Time Zone: GMT +3
Time Frame: Daily (D1) / Weekly Outlook
Weekly Fundamental Overview:
The GBP/AUD pair continues to navigate balanced market forces as economic indicators guide investor expectations. Traders remain focused on upcoming domestic inflation releases to gauge macroeconomic momentum and prospective policy shifts.
Price Action:
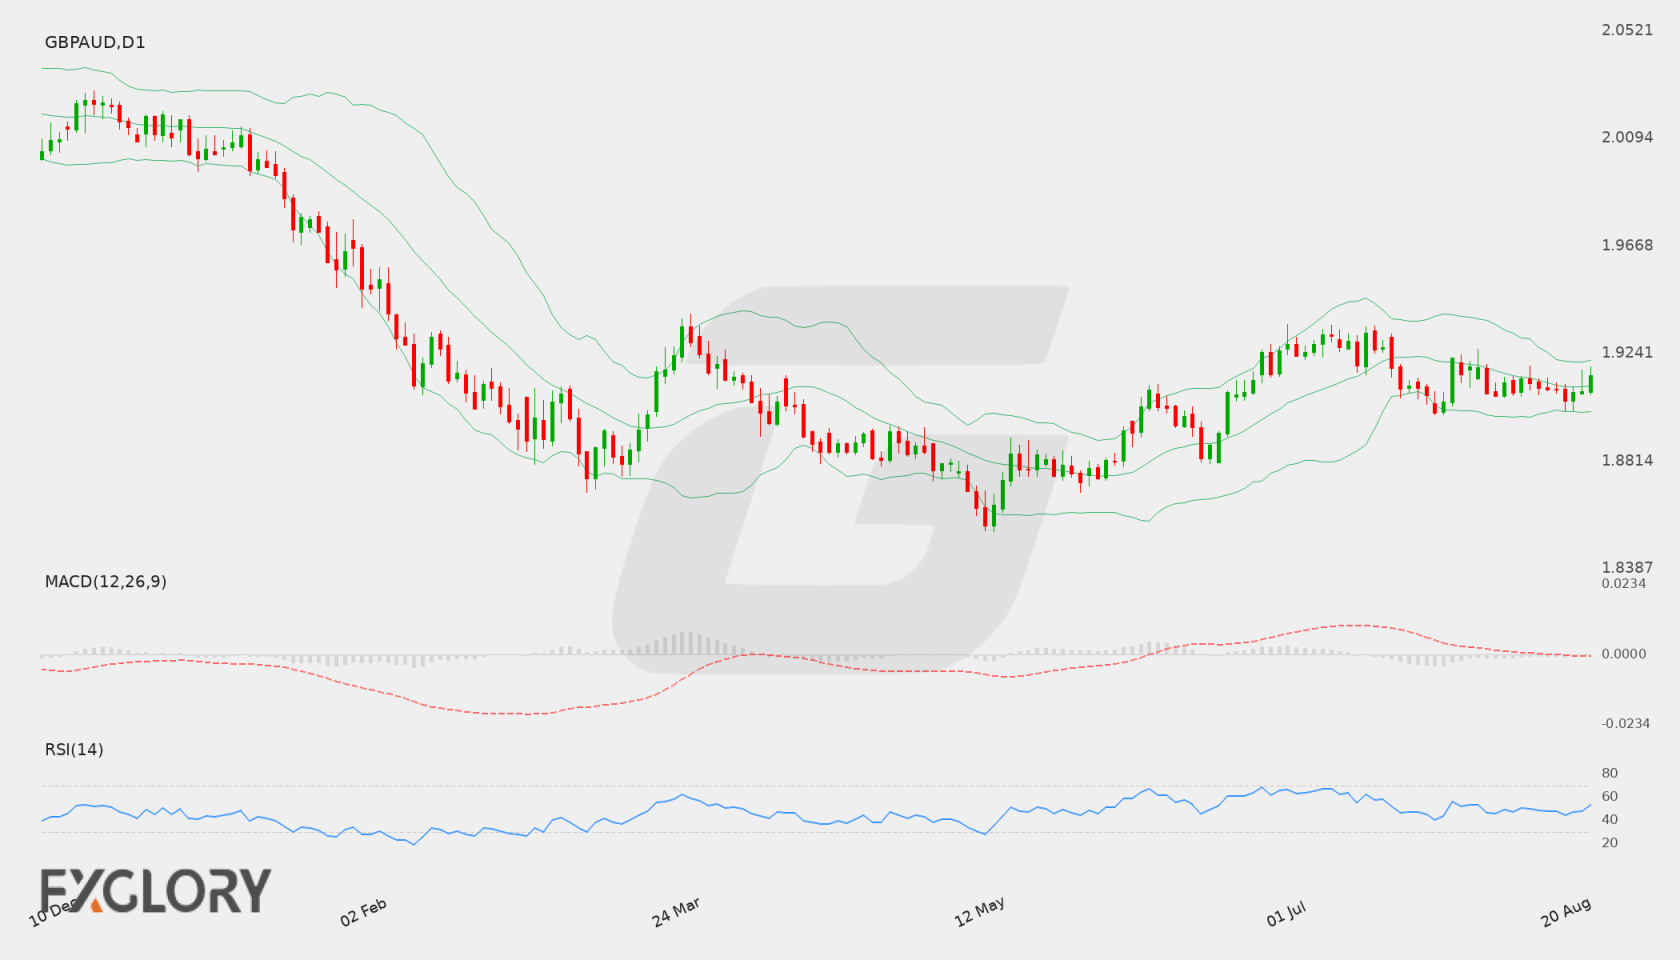
GBP/AUD recently settled at 1.91526, rising after finding buying interest above recent daily lows. The price action demonstrates steady upward movement as daily candles trade above recent consolidation levels.
Key Technical Indicators:
Bollinger Bands: On the daily chart, the Bollinger Bands display a middle line at 1.91098, an upper band at 1.92114, and a lower band at 1.90082. With the current price at 1.91526 positioned above the middle band, the structure points to a mild bullish tilt within the current band range.
RSI: The 14-day Relative Strength Index (RSI) reads at 53.40. This reflects a neutral reading with a slight bullish posture, keeping price out of both overbought and oversold territories.
MACD: The MACD indicator registers at -0.0008676, remaining slightly below the zero line. This indicates that while recent daily price action shows upward recovery, broader momentum has yet to trigger a clear bullish signal.
Support and Resistance:
Technical charts outline primary support at 1.86879 to protect against downside pressure. On the upside, main resistance sits at 1.93568, marking the key ceiling for bullish momentum.
News to Watch for GBPAUD This Week:
- CPI m/m: Monthly inflation tracking can influence short-term price valuation and market sentiment.
- Trimmed Mean CPI m/m: Core consumer price measures help evaluate underlying inflationary trends.
- CPI y/y: Annual inflation figures offer crucial perspective on longer-term economic momentum.
Weekly Outlook and Consideration:
GBP/AUD enters the trading period around 1.91526, maintaining a position above its middle Bollinger Band of 1.91098. A continued advance past the upper band at 1.92114 may open the door for price action to challenge key resistance near 1.93568. On the other hand, if price breaks below 1.91098, lower Bollinger support at 1.90082 could be tested before primary support at 1.86879 is exposed. With RSI at 53.40 and MACD slightly negative, the pair suggests market consolidation with prospective breakout paths.
Disclaimer: The analysis provided for GBP/AUD is for informational purposes only and does not constitute investment advice. Traders are encouraged to perform their own analysis and research before making any trading decisions. Market conditions can change quickly, so staying informed with the latest data is essential.