Time Zone: GMT +3
Time Frame: Daily (D1) / Weekly Outlook
Weekly Fundamental Overview:
The AUD/CAD currency pair reflects the ongoing balance between Australian economic performance and Canadian market dynamics. Broader market sentiment remains linked to global growth trends, commodity demand, and upcoming labor market data, which could influence expectations around interest rate paths.
Price Action:
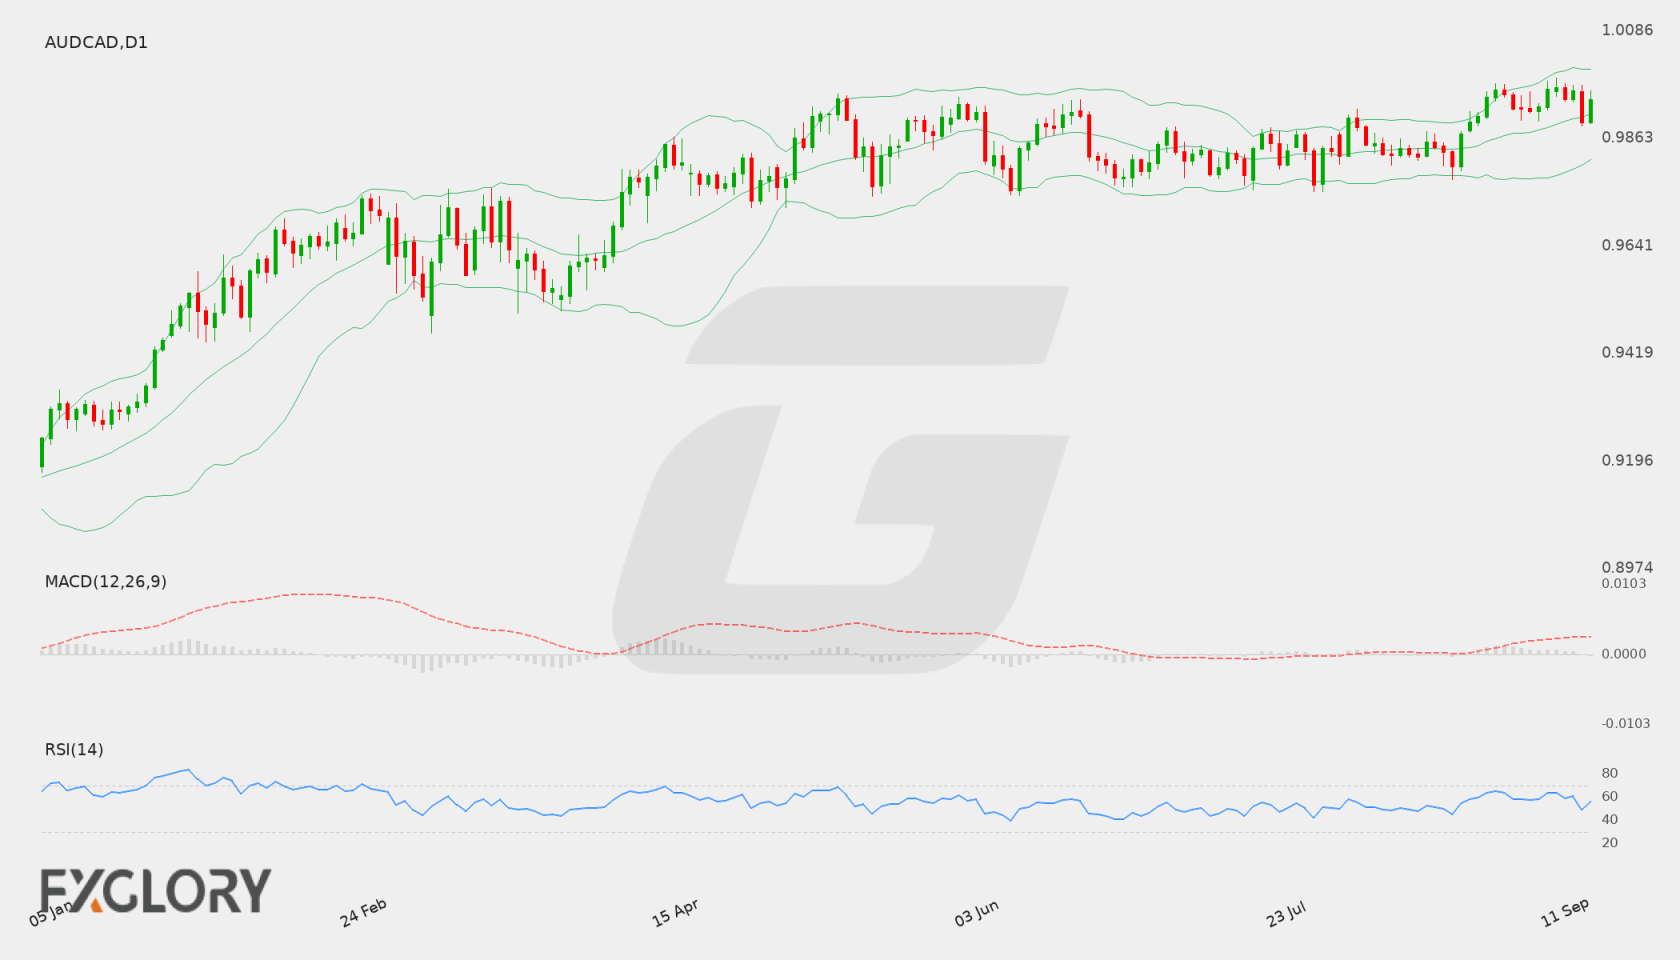
On the daily (D1) chart, AUD/CAD recently rebounded from a daily low of 0.98975 to settle near 0.99438. The pair continues to print higher lows over recent sessions, although overhead selling pressure near previous local highs keeps price action contained below psychological levels.
Key Technical Indicators:
Bollinger Bands: The daily Bollinger Bands place the middle line at 0.99133, with an upper band at 1.00065 and a lower band at 0.98201. Trading at 0.99438, AUD/CAD remains positioned above the mid-band baseline, pointing to a mild bullish tilt within the current envelope.
RSI: The 14-period Relative Strength Index (RSI) sits at 55.79. Holding above the 50 centerline while staying below the 70 overbought threshold, the indicator reflects stable upside momentum with room for movement in either direction.
MACD: The MACD indicator on the daily timeframe registers at 0.00236. Holding in positive territory, the MACD points to persistent underlying buying interest, though momentum remains steady rather than aggressive.
Support and Resistance:
Key technical levels for AUD/CAD include immediate resistance at 0.99880, which marks a significant overhead barrier. On the downside, critical daily support is established at 0.97524.
News to Watch for AUDCAD This Week:
- Employment Change: This indicator provides insight into labor market strength that could influence domestic interest rate expectations.
- Unemployment Rate: The jobless rate offers crucial data on economic stability and broader employment market trends.
Weekly Outlook and Consideration:
AUD/CAD maintains a constructive outlook as it trades at 0.99438, above its daily middle Bollinger Band of 0.99133. Positive MACD momentum (0.00236) and a supportive RSI level of 55.79 suggest buyers retain control in the short term. A continued advance may target resistance at 0.99880, whereas a pullback would turn focus toward support at 0.97524 and fundamental risk drivers.
Disclaimer: The analysis provided for AUD/CAD is for informational purposes only and does not constitute investment advice. Traders are encouraged to perform their own analysis and research before making any trading decisions. Market conditions can change quickly, so staying informed with the latest data is essential.