Time Zone: GMT +3
Time Frame: Daily (D1) / Weekly Outlook
Weekly Fundamental Overview:
The USD/MXN currency pair heads into the upcoming week guided by a slate of critical United States macroeconomic data points and overarching market risk sentiment. Shifts in economic momentum and monetary policy expectations are set to steer the US dollar, with traders evaluating the health of the services sector, consumer sentiment trends, and labor market resilience. Meanwhile, emerging market currencies such as the Mexican peso remain sensitive to broader risk appetite and interest rate differential dynamics.
Price Action:
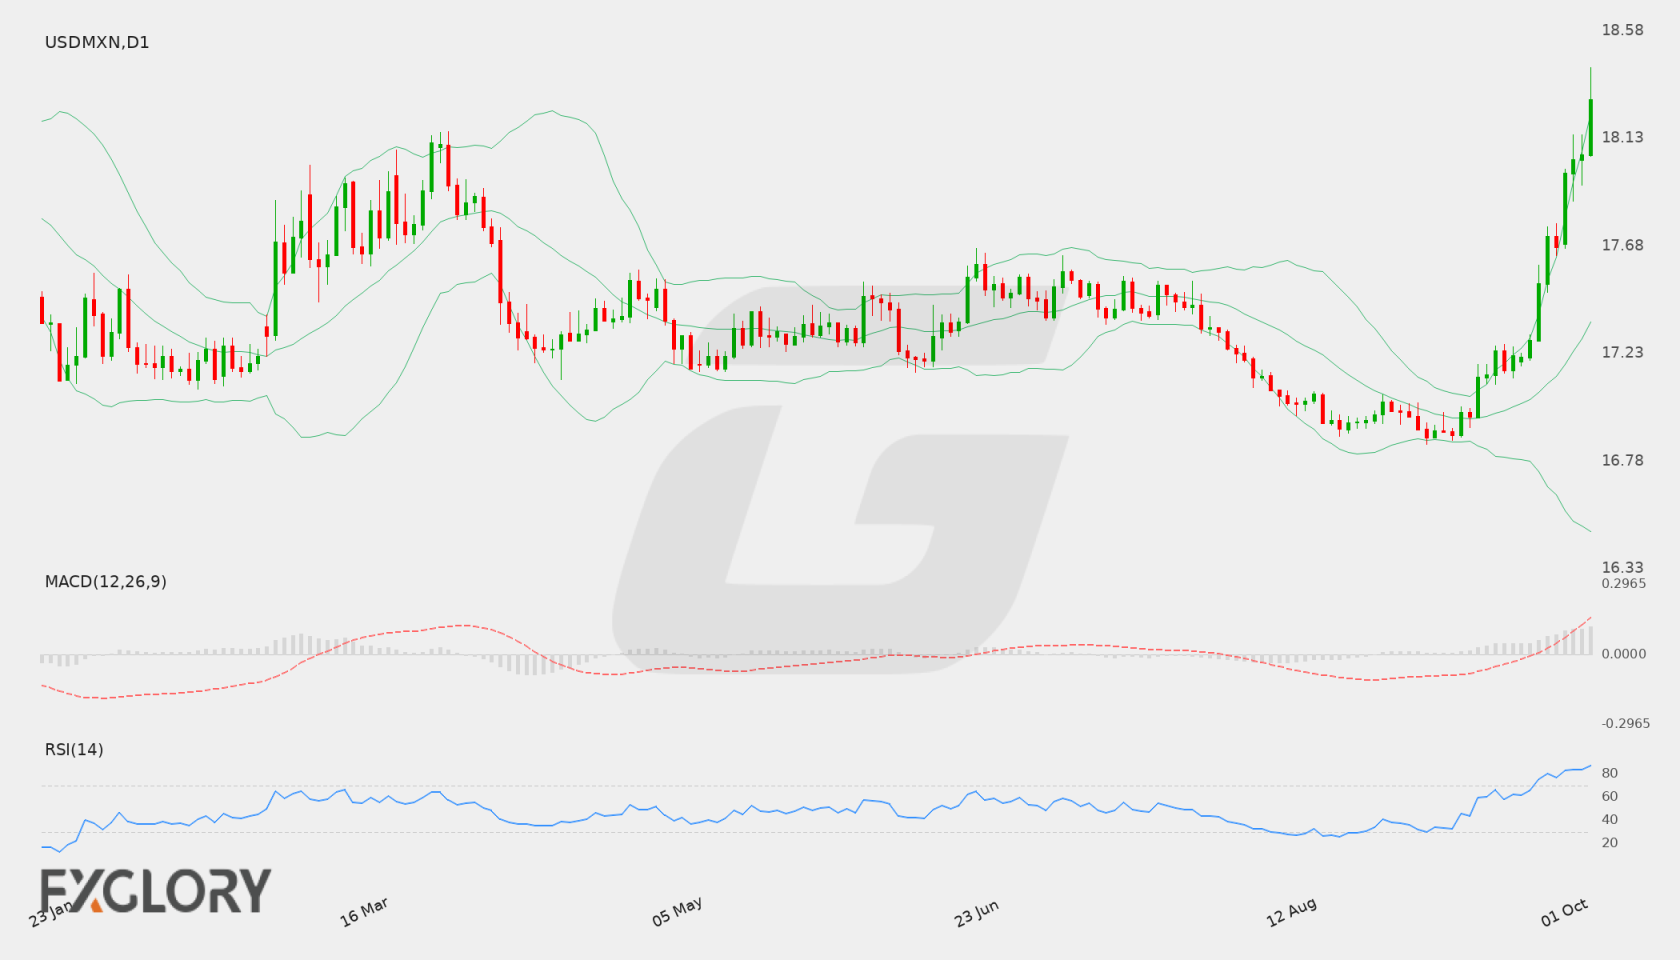
On the daily chart, USD/MXN has demonstrated pronounced upward momentum, driving higher from the 16.90 region and closing the latest session at 18.29208. The recent sequence of daily candles reveals consistent buying pressure, capped by an intraday test of 18.42473 before settling slightly lower. This persistent series of higher closes underscores strong demand, though the steep climb has pushed price action into extended territory.
Key Technical Indicators:
Bollinger Bands: The Bollinger Bands indicator highlights expanding volatility for USD/MXN. The middle band sits at 17.36120, flanked by an upper band at 18.23650 and a lower band at 16.48590. With the latest close at 18.29208 pushing above the upper band, the pair reflects an aggressive expansion phase that often signals stretched market conditions.
RSI: The 14-day Relative Strength Index (RSI) for USD/MXN is registered at 86.77. This places the indicator deep within overbought territory, signaling that the recent bullish run has become technically overstretched, which may increase the likelihood of temporary price consolidation or a corrective pause.
MACD: The daily MACD reading for USD/MXN stands at 0.26957, holding in positive territory. This positive value reflects solid upward momentum driving the pair higher, confirming that the prevailing daily trend remains tilted toward the buyers.
Support and Resistance:
Technical levels on the daily timeframe outline immediate resistance at 18.42473, which represents the recent high point of the current advance. On the downside, primary technical support is established at 16.85067, marking the base from which the broader uptrend originated.
News to Watch for USDMXN This Week:
- ISM Services PMI: This release provides insight into the expansion or contraction of the US services sector and can influence demand for the US dollar.
- FOMC Meeting Minutes: Detailed commentary from the monetary policy meeting may offer clues regarding future interest rate decisions.
- Unemployment Claims: Weekly labor market data can impact sentiment surrounding the strength of the US employment backdrop.
- Prelim UoM Inflation Expectations: Consumer perspectives on price pressures help shape market expectations for future inflation trends.
- Prelim UoM Consumer Sentiment: Gauging consumer confidence levels provides context on household spending appetite and overall economic health.
Weekly Outlook and Consideration:
USD/MXN enters the week exhibiting robust bullish technicals on the daily timeframe, evidenced by a close of 18.29208, a positive MACD of 0.26957, and price trading above the upper Bollinger Band of 18.23650. However, with the daily RSI extended at 86.77, the pair faces overbought conditions as it confronts key resistance at 18.42473. Traders will be monitoring whether upside momentum can sustain a breach of current highs or if overextended indicators will invite a retracement toward support levels, notably with the 16.85067 floor defining the broader structural base.
Disclaimer: The analysis provided for USD/MXN is for informational purposes only and does not constitute investment advice. Traders are encouraged to perform their own analysis and research before making any trading decisions. Market conditions can change quickly, so staying informed with the latest data is essential.