Time Zone: GMT +3
Time Frame: Daily (D1) / Weekly Outlook
Weekly Fundamental Overview:
Fundamental drivers for NZD/CHF remain anchored to general shifts in global risk sentiment and market evaluations of central bank policy paths. Without incoming domestic scheduled releases, the pair continues to reflect broader macro themes, where changes in risk appetite and cross-currency capital flows influence overall trajectory.
Price Action:
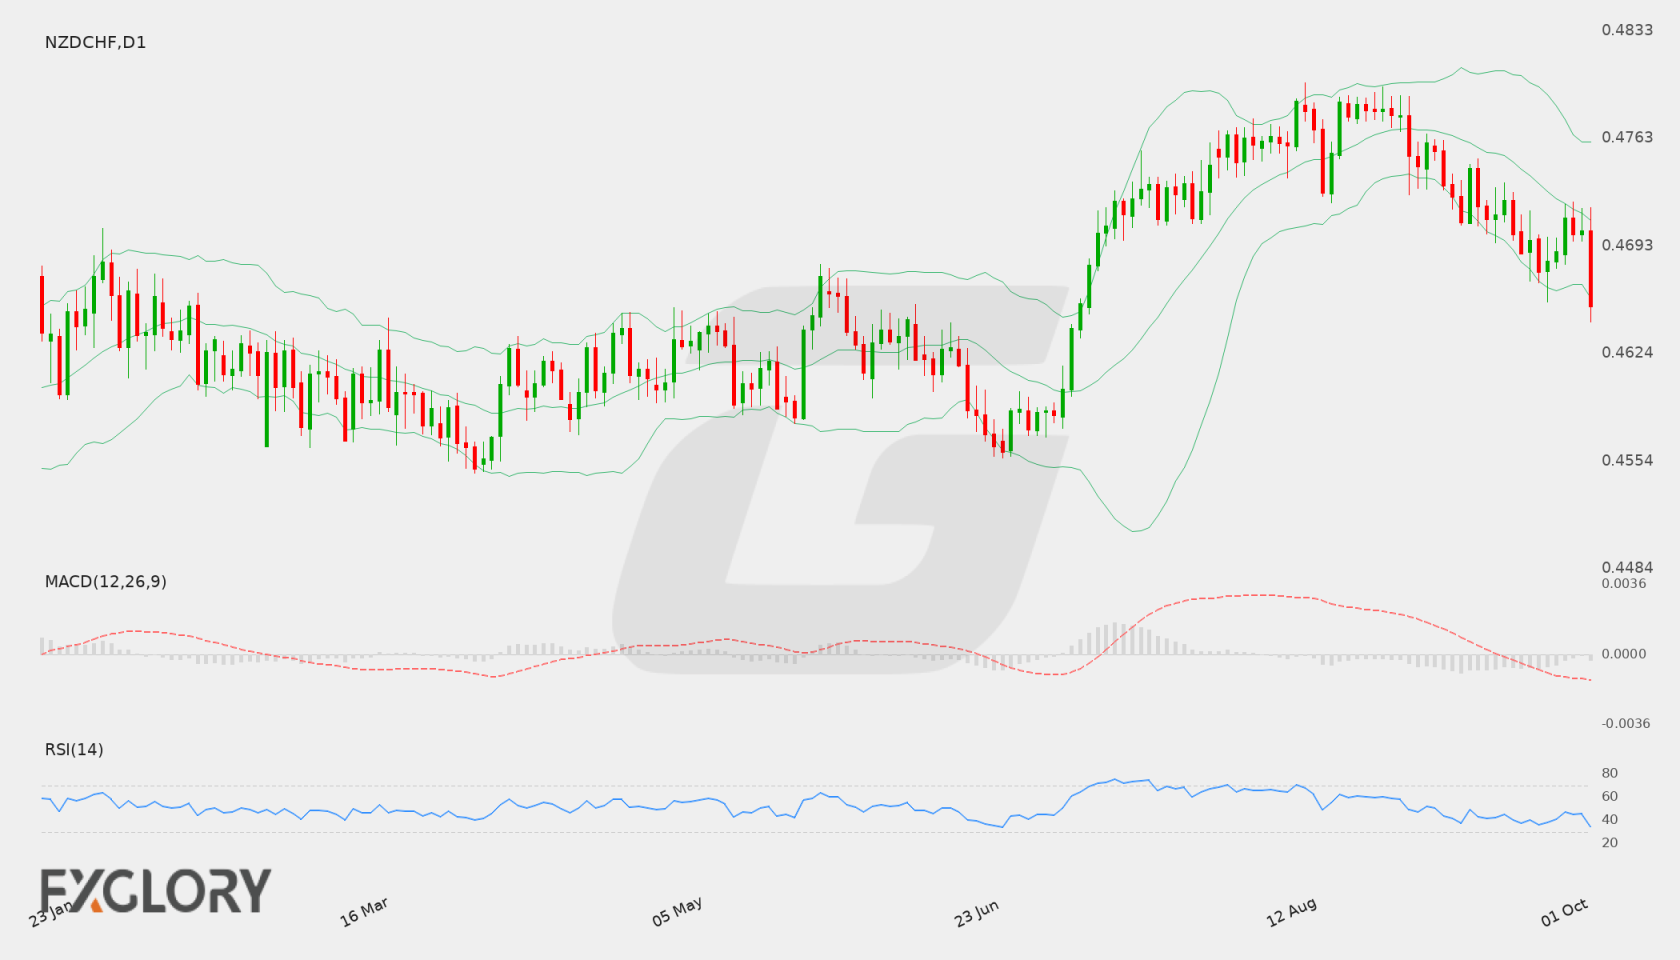
On the daily timeframe, NZD/CHF demonstrated strong downward pressure during the latest session. The pair opened at 0.47030, reached an intraday high of 0.47185, and dropped to an intraday low of 0.46441 before settling at 0.46544 on elevated volume of 56,006, confirming persistent selling interest near recent lows.
Key Technical Indicators:
Bollinger Bands: Bollinger Bands reflect widening volatility, with the middle band positioned at 0.47100, the upper band at 0.47608, and the lower band at 0.46593. The recent close of 0.46544 trades beneath the lower band, highlighting extended downward momentum on the daily chart.
RSI: The 14-period Relative Strength Index (RSI) stands at 34.69. This reading indicates sustained downward pressure while approaching territory near the oversold threshold.
MACD: The daily MACD line reads -0.00162, maintaining its stance beneath the zero line and pointing to prevailing bearish momentum in the absence of an immediate upside crossover.
Support and Resistance:
Technical reference points for NZD/CHF highlight primary daily support at 0.46336 and overhead resistance at 0.47995, defining the broader boundaries for upcoming price fluctuations.
News to Watch for NZDCHF This Week:
- No specific events are available on the calendar; market participants may monitor generic high-impact releases, central bank comments, and broader risk sentiment for direction.
Weekly Outlook and Consideration:
The weekly outlook for NZD/CHF (NZDCHF) indicates a bearish technical tilt following the close at 0.46544 below the lower Bollinger Band of 0.46593. With the MACD at -0.00162 and RSI at 34.69, selling pressure remains evident. Holding above immediate support at 0.46336 will be pivotal to curbing further declines, whereas any potential recovery toward the middle band at 0.47100 would face major overhead resistance near 0.47995.
Disclaimer: The analysis provided for NZD/CHF is for informational purposes only and does not constitute investment advice. Traders are encouraged to perform their own analysis and research before making any trading decisions. Market conditions can change quickly, so staying informed with the latest data is essential.