Time Zone: GMT +3
Time Frame: Daily (D1) / Weekly Outlook
Weekly Fundamental Overview:
CAD/JPY traders are keeping a close eye on economic conditions in Canada and Japan, with broader macroeconomic trends exerting influence over pair valuations. Upcoming Canadian economic growth statistics are poised to act as a significant driver for relative currency valuation in the upcoming sessions.
Price Action:
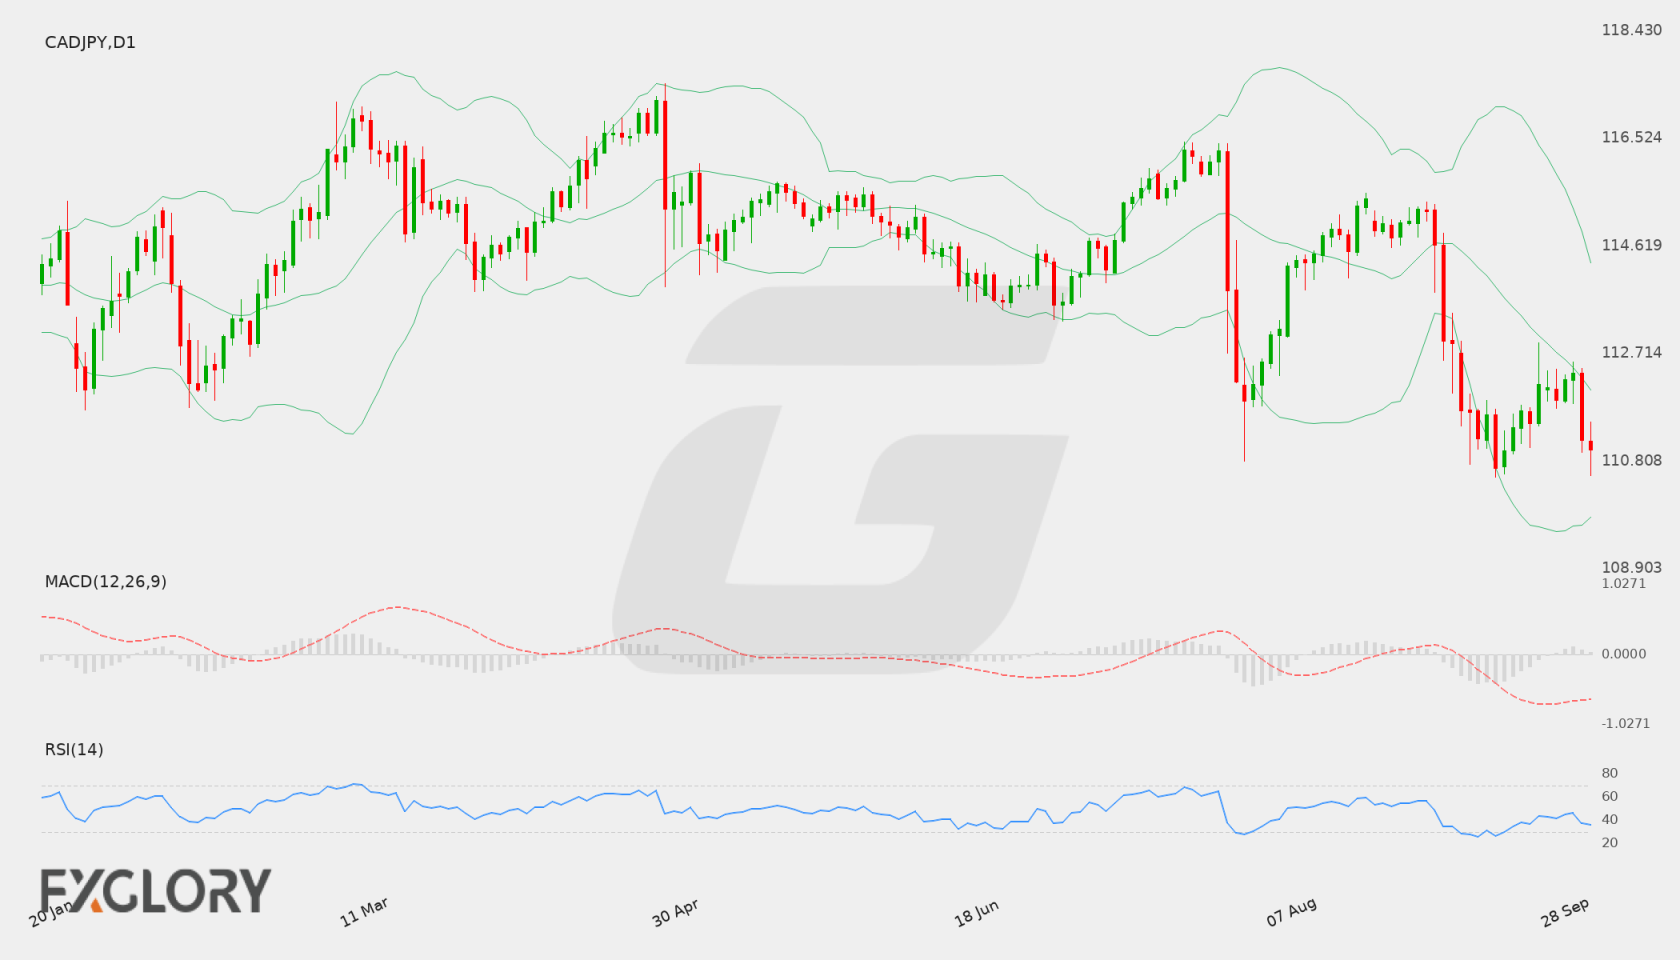
The daily D1 chart shows recent downward momentum for CAD/JPY, with the pair dropping from recent trading levels around 112.359 down to a recent close at 111.013. The step-down in daily candles highlights active selling interest as price tests lower ranges.
Key Technical Indicators:
Bollinger Bands: The daily Bollinger Bands reveal a middle band at 112.059, an upper band at 114.314, and a lower band at 109.804. Trading at 111.013, the price sits beneath the middle band, signaling a bearish environment as it moves toward the lower band boundary.
RSI: The 14-day Relative Strength Index (RSI) is currently recorded at 36.15. Resting below the neutral 50 level, it signals dominant bearish pressure while remaining above the traditional oversold threshold of 30.
MACD: The MACD line is positioned below the signal line in negative territory with a value of -0.635. This negative value reflects sustained bearish momentum across the daily timeframe for CAD/JPY.
Support and Resistance:
Key technical benchmarks for CAD/JPY are defined by support at 110.524 and resistance at 116.454. With the pair closing at 111.013, price is currently hovering closer to the immediate support zone.
News to Watch for CADJPY This Week:
- GDP m/m: Monthly Canadian economic growth data provides crucial economic insight that could sway CAD strength against the Japanese yen.
Weekly Outlook and Consideration:
The weekly perspective for CAD/JPY remains weighted toward the downside as technical indicators point toward prevailing bearish bias. With the RSI at 36.15 and MACD at -0.635, the pair trades under the Bollinger middle band of 112.059. A break below immediate support at 110.524 could open the path toward lower territory near the lower Bollinger band at 109.804, whereas any relief rebound would confront overhead resistance towards 116.454.
Disclaimer: The analysis provided for CAD/JPY is for informational purposes only and does not constitute investment advice. Traders are encouraged to perform their own analysis and research before making any trading decisions. Market conditions can change quickly, so staying informed with the latest data is essential.