Time Zone: GMT +3
Time Frame: Daily (D1) / Weekly Outlook
Weekly Fundamental Overview:
Market participants analyzing USD/MXN are focusing on upcoming economic releases that could influence interest rate expectations and risk appetite. Fundamental sentiment for USDMXN remains sensitive to macroeconomic reports, where stronger economic signals may bolster the currency while weaker indicators could restrain upward movement.
Price Action:
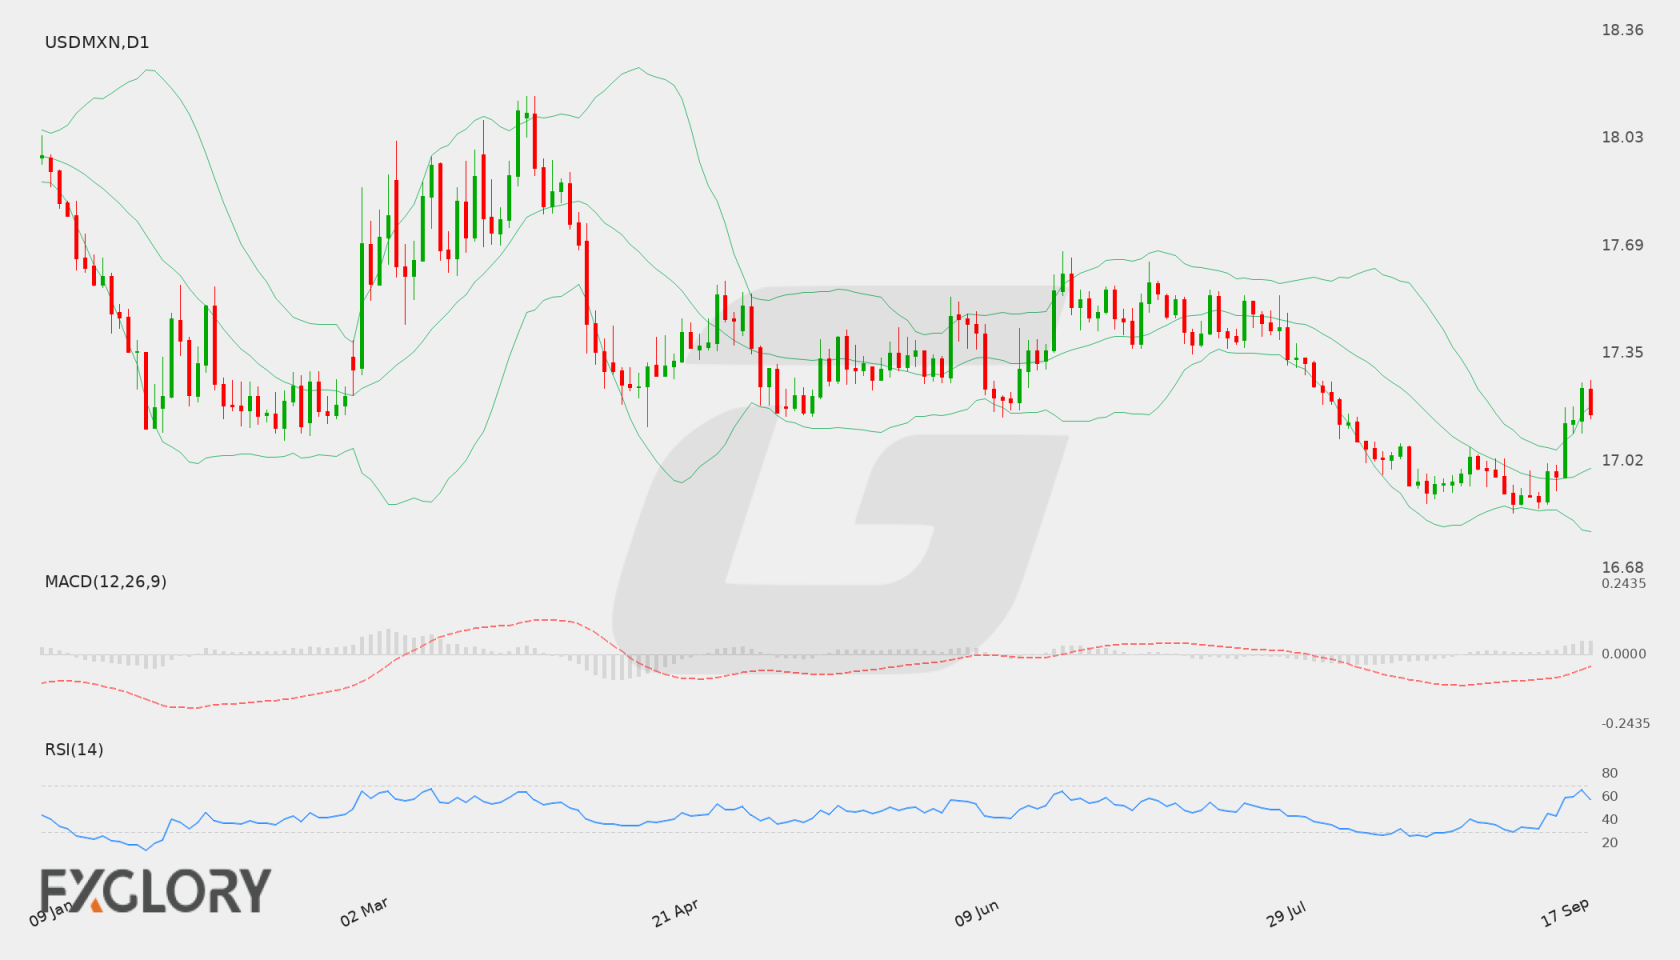
On the Daily (D1) chart, USD/MXN recently closed at 17.16087 following a rebound from lower levels near 16.88027. Recent price action indicates recovery off recent lows toward the upper boundary of the recent trading range.
Key Technical Indicators:
Bollinger Bands: The Daily Bollinger Bands reflect a middle line at 16.99082, an upper band at 17.18711, and a lower band at 16.79454. With the latest close at 17.16087, price action is hovering near the upper band, indicating tested resistance near higher band boundaries.
RSI: The 14-period Relative Strength Index (RSI) is currently positioned at 58.22, placing USD/MXN in neutral-to-bullish territory above the 50 mark without reaching overbought conditions.
MACD: The MACD line stands at a positive 0.001574, operating above the zero threshold. This reading suggests mild upward momentum on the daily timeframe for USD/MXN.
Support and Resistance:
Key daily technical levels for USD/MXN showcase primary support at 16.85067 and resistance at 17.63792.
News to Watch for USDMXN This Week:
- CB Consumer Confidence: This indicator reflects overall consumer sentiment and economic expectations.
- JOLTS Job Openings: This metric provides insight into labor market demand and hiring activity.
- ADP Non-Farm Employment Change: This report measures estimated private sector employment trends.
- Core PCE Price Index m/m: This inflation measure tracks underlying price changes in consumer spending.
- Final GDP q/q: This statistic evaluates overall national economic output and growth performance.
- ISM Manufacturing PMI: This index gauges operational conditions and activity in the manufacturing sector.
- Average Hourly Earnings m/m: This wage reading indicates labor cost developments and potential inflationary pressures.
- Non-Farm Employment Change: This key employment dataset reveals net monthly job creation.
- Unemployment Rate: This figure shows the percentage of the workforce actively seeking employment.
Weekly Outlook and Consideration:
The weekly outlook for USD/MXN presents a balanced technical setup as the pair trades near 17.16087. With the RSI at 58.22 and the MACD at 0.001574, indicators lean mildly positive, keeping price near the upper Bollinger Band of 17.18711. A sustained move higher could test key resistance at 17.63792, while a move lower could see the exchange rate return toward the middle band at 16.99082 or key support at 16.85067.
Disclaimer: The analysis provided for USD/MXN is for informational purposes only and does not constitute investment advice. Traders are encouraged to perform their own analysis and research before making any trading decisions. Market conditions can change quickly, so staying informed with the latest data is essential.