Time Zone: GMT +3
Time Frame: Daily (D1) / Weekly Outlook
Weekly Fundamental Overview:
The NZD/CHF currency pair reflects market sentiment surrounding economic performance in New Zealand against Swiss economic stability. As a high-beta growth currency, the New Zealand Dollar remains sensitive to global risk appetite, whereas the Swiss Franc is influenced by capital preservation flows and domestic monetary policy. Recent price behavior highlights a cautious market environment as traders weigh broad interest rate differentials and economic momentum.
Price Action:
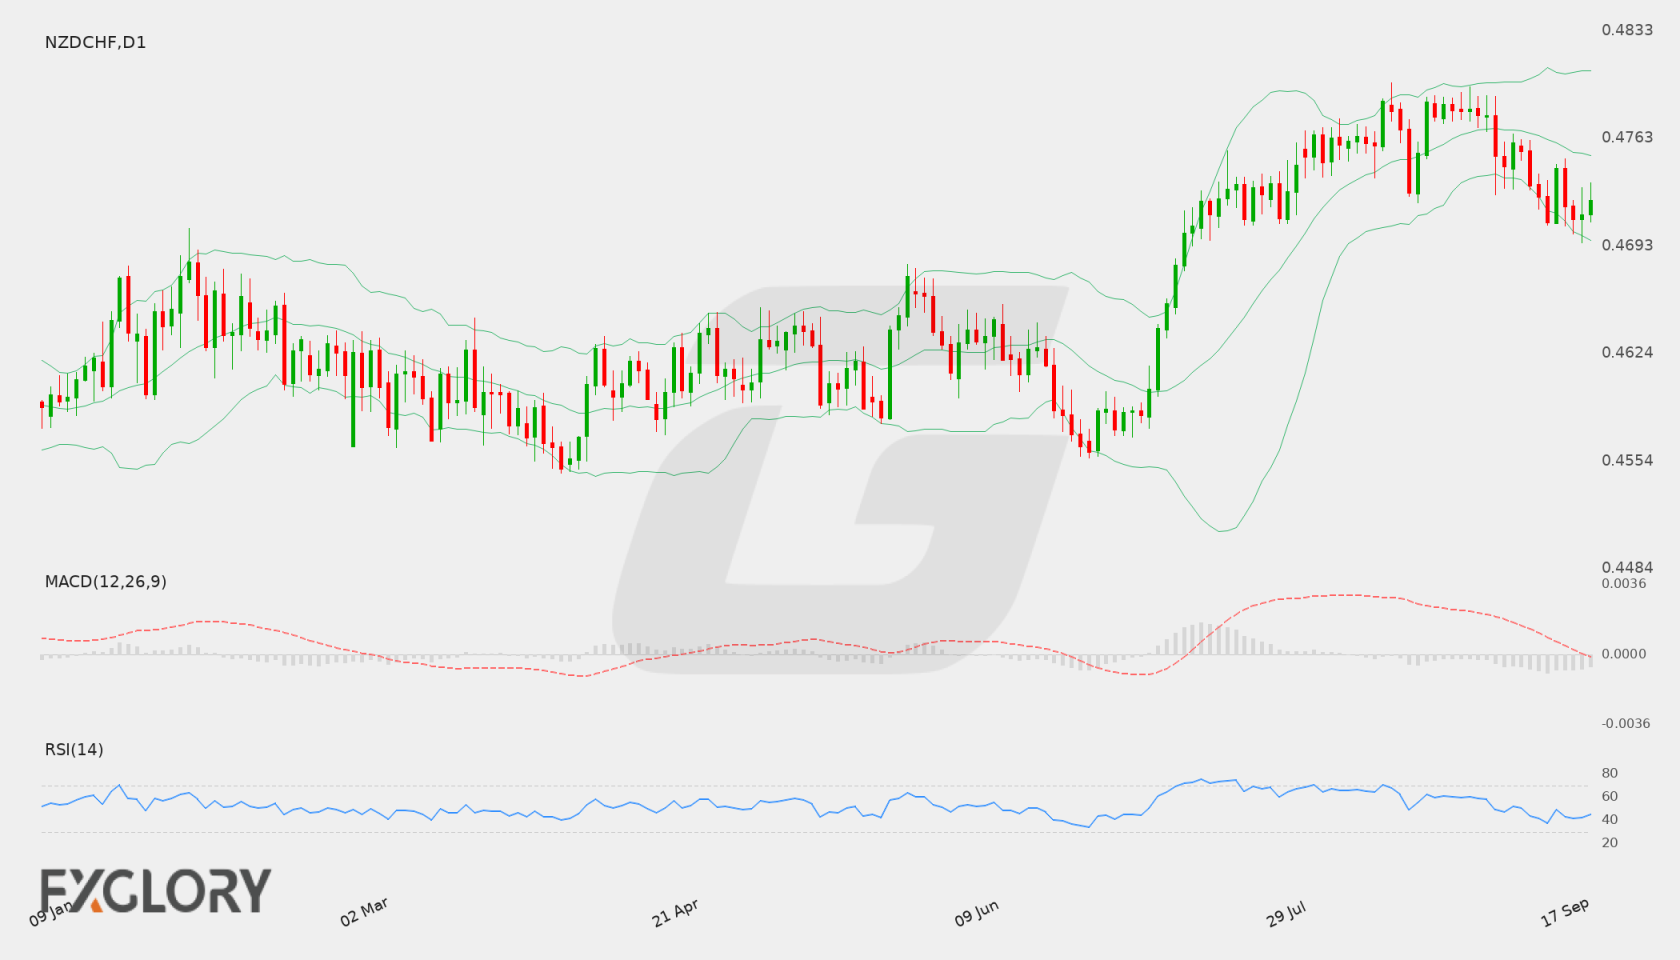
On the daily (D1) chart, NZD/CHF recently pulled back from recent highs near 0.47820 down toward 0.47087 before recovering slightly to close at 0.47231. The pair exhibits a minor consolidation structure, with candles showing upper wicks near intraday highs, indicating overhead selling pressure whenever price attempts to rally.
Key Technical Indicators:
Bollinger Bands: The Bollinger Bands indicate a middle band at 0.47521, an upper band at 0.48072, and a lower band at 0.46970. NZD/CHF is currently trading at 0.47231, placing it in the lower half of the band channel below the 20-period average, which points to a subdued technical bias.
RSI: The 14-period Relative Strength Index (RSI) stands at 45.03. Sitting just below the neutral 50 mark, the indicator signals modest bearish control while remaining well clear of oversold conditions.
MACD: The daily MACD indicator registers a negative value of -0.00078. The signal line and histogram remain beneath the zero line, reflecting prevailing short-term bearish momentum across daily timeframes.
Support and Resistance:
Key resistance is defined at 0.47995, representing a significant barrier against potential upward extensions. Major support is located lower down at 0.45558, which serves as a major floor for medium-term price structure.
News to Watch for NZDCHF This Week:
- CPI m/m: This monthly consumer price index release tracks inflation trends in Switzerland and can impact market expectations for Swiss monetary policy.
Weekly Outlook and Consideration:
For the upcoming week, NZD/CHF remains capped under the middle Bollinger band at 0.47521. A break above this level could pave the way for a test of the 0.47995 resistance zone. However, with RSI below 50 and a negative MACD, continued weakness could see sellers drive price action back toward the lower Bollinger band near 0.46970, with major support further below at 0.45558.
Disclaimer: The analysis provided for NZD/CHF is for informational purposes only and does not constitute investment advice. Traders are encouraged to perform their own analysis and research before making any trading decisions. Market conditions can change quickly, so staying informed with the latest data is essential.