Time Zone: GMT +3
Time Frame: Daily (D1) / Weekly Outlook
Weekly Fundamental Overview:
The NZD/CAD pair continues to reflect shifting risk sentiment and economic performance between New Zealand and Canada. Market participants remain attentive to broader economic momentum and upcoming Canadian output data, which could influence short-term currency valuation and direction for NZD/CAD.
Price Action:
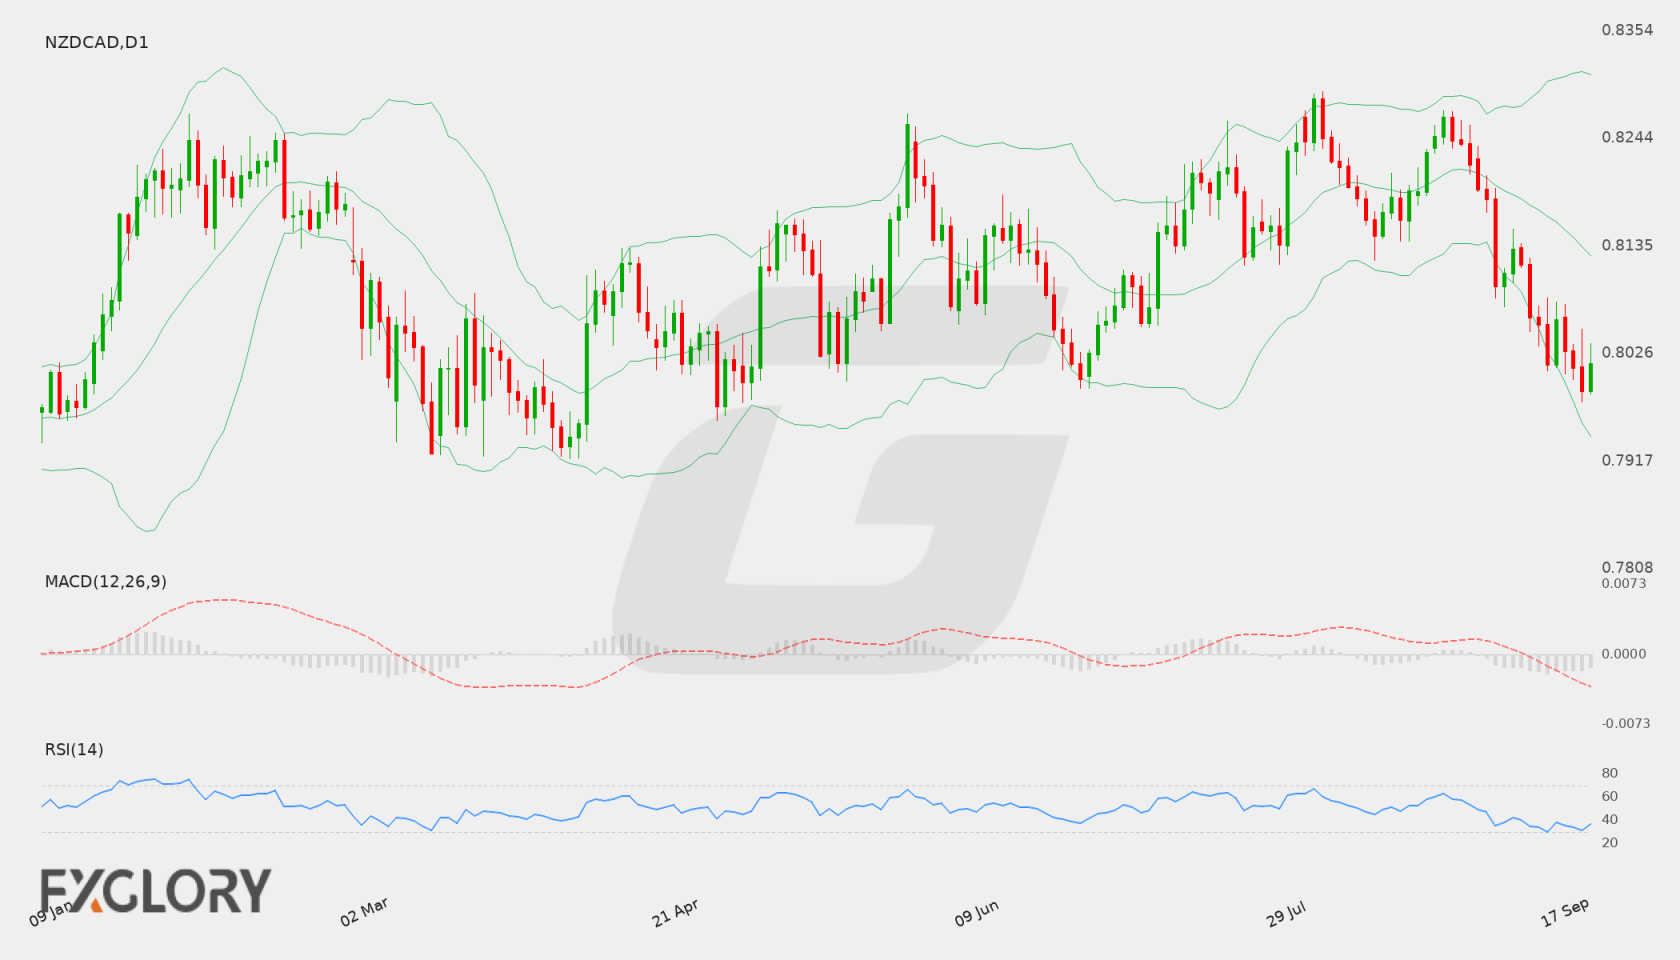
On the Daily (D1) timeframe, NZD/CAD has displayed a clear corrective trajectory after reaching recent peaks near 0.8266. The exchange rate recently closed at 0.80158, stabilizing slightly above key local lows after experiencing consecutive daily declines.
Key Technical Indicators:
Bollinger Bands: The Bollinger Bands on the D1 chart show the middle baseline sitting at 0.81254, with the upper band at 0.83088 and lower band at 0.79420. Trading below the middle band signals lingering bearish pressure as price action leans closer to the lower volatility boundary.
RSI: The 14-day Relative Strength Index (RSI) is positioned at 36.42. Holding below the neutral 50 level, the reading highlights persistent bearish sentiment while staying slightly above oversold conditions.
MACD: The MACD indicator registers at -0.00479, holding in negative territory. This negative value reflects sustained downward momentum and suggests that sellers currently maintain control over short-term price movements.
Support and Resistance:
Key technical levels for NZD/CAD include primary support at 0.79769 and major resistance at 0.82919.
News to Watch for NZDCAD This Week:
- GDP m/m: This monthly release measures Canadian economic output and could spark volatility across Canadian Dollar currency pairs.
Weekly Outlook and Consideration:
The technical outlook for NZD/CAD remains titled to the downside based on Daily chart signals. With price trading under the middle Bollinger Band at 0.81254, negative MACD histogram momentum, and an RSI of 36.42, downside pressure persists. A breach below support at 0.79769 could extend lower tests toward the lower Bollinger Band at 0.79420. Alternatively, any bullish recovery would need to overcome resistance at 0.82919 to alter the current technical structure.
Disclaimer: The analysis provided for NZD/CAD is for informational purposes only and does not constitute investment advice. Traders are encouraged to perform their own analysis and research before making any trading decisions. Market conditions can change quickly, so staying informed with the latest data is essential.