Time Zone: GMT +3
Time Frame: Daily (D1) / Weekly Outlook
Weekly Fundamental Overview:
The CAD/CHF currency pair reflects the balance between Canadian economic performance, commodity market dynamics, and the safe-haven status of the Swiss Franc. Recent trading shows Canadian Dollar resilience against the Swiss Franc, driven by changing rate expectations and broader market risk sentiment.
Price Action:
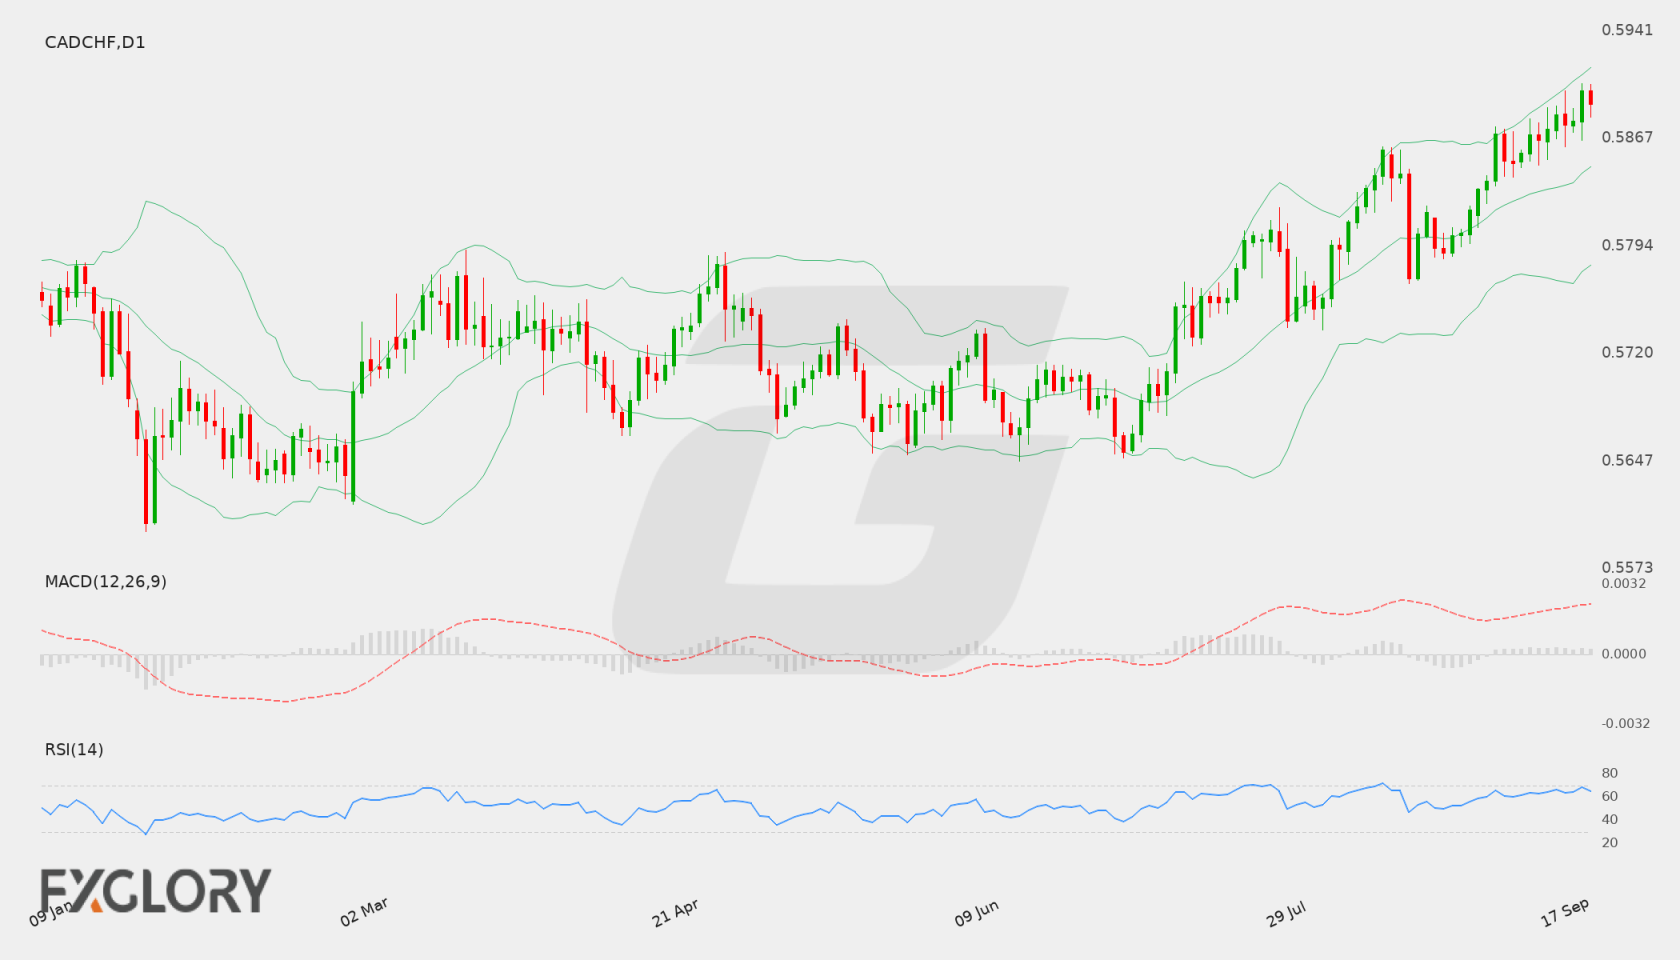
On the daily chart, CAD/CHF has established a steady upward trajectory over recent sessions, rising from early-period lows around 0.56529 to reach a recent high near 0.59048 before closing at 0.58912. Higher daily highs and higher daily lows over the past two weeks highlight sustained buying pressure.
Key Technical Indicators:
Bollinger Bands: The daily Bollinger Bands display an expanding channel, reflecting increased price volatility. CAD/CHF is trading near the upper band at 0.59154, well above the middle band at 0.58480, which signals strong bullish momentum across recent daily candles.
RSI: The 14-day Relative Strength Index (RSI) stands at 64.76. This places the indicator above the neutral 50 line, confirming bullish control while remaining below the overbought threshold of 70.
MACD: The MACD indicator remains in positive territory with a reading of 0.002487. The MACD histogram continues to print positive values, indicating that upward momentum remains intact on the daily timeframe.
Support and Resistance:
Immediate resistance for CAD/CHF is positioned at 0.59048, near recent daily peak levels. On the downside, primary support is identified at 0.56485, with dynamic mid-band support located near 0.58480.
News to Watch for CADCHF This Week:
- GDP m/m: Monthly gross domestic product figures provide insight into Canadian economic growth and potential monetary policy shifts.
- CPI m/m: Consumer price index data offers crucial signals regarding Swiss inflation trends and central bank interest rate policy.
Weekly Outlook and Consideration:
CAD/CHF enters the upcoming week with a distinct bullish bias after settling near 0.58912. Technical indicators support further upside potential, as the positive MACD and an RSI of 64.76 reflect ongoing momentum. A successful breach of the 0.59048 resistance level could open the door toward the upper Bollinger Band near 0.59154. Conversely, if buyers fail to clear resistance, a minor retracement toward the middle Bollinger Band at 0.58480 may occur before any potential resumption of the uptrend.
Disclaimer: The analysis provided for CAD/CHF is for informational purposes only and does not constitute investment advice. Traders are encouraged to perform their own analysis and research before making any trading decisions. Market conditions can change quickly, so staying informed with the latest data is essential.