Time Zone: GMT +3
Time Frame: Daily (D1) / Weekly Outlook
Weekly Fundamental Overview:
AUD/USD fundamental dynamics continue to be shaped by interest rate expectations and economic indicators from both Australia and the United States. Key domestic factors include monetary policy announcements and inflation metrics, while US employment data and price indices provide critical direction for the exchange rate.
Price Action:
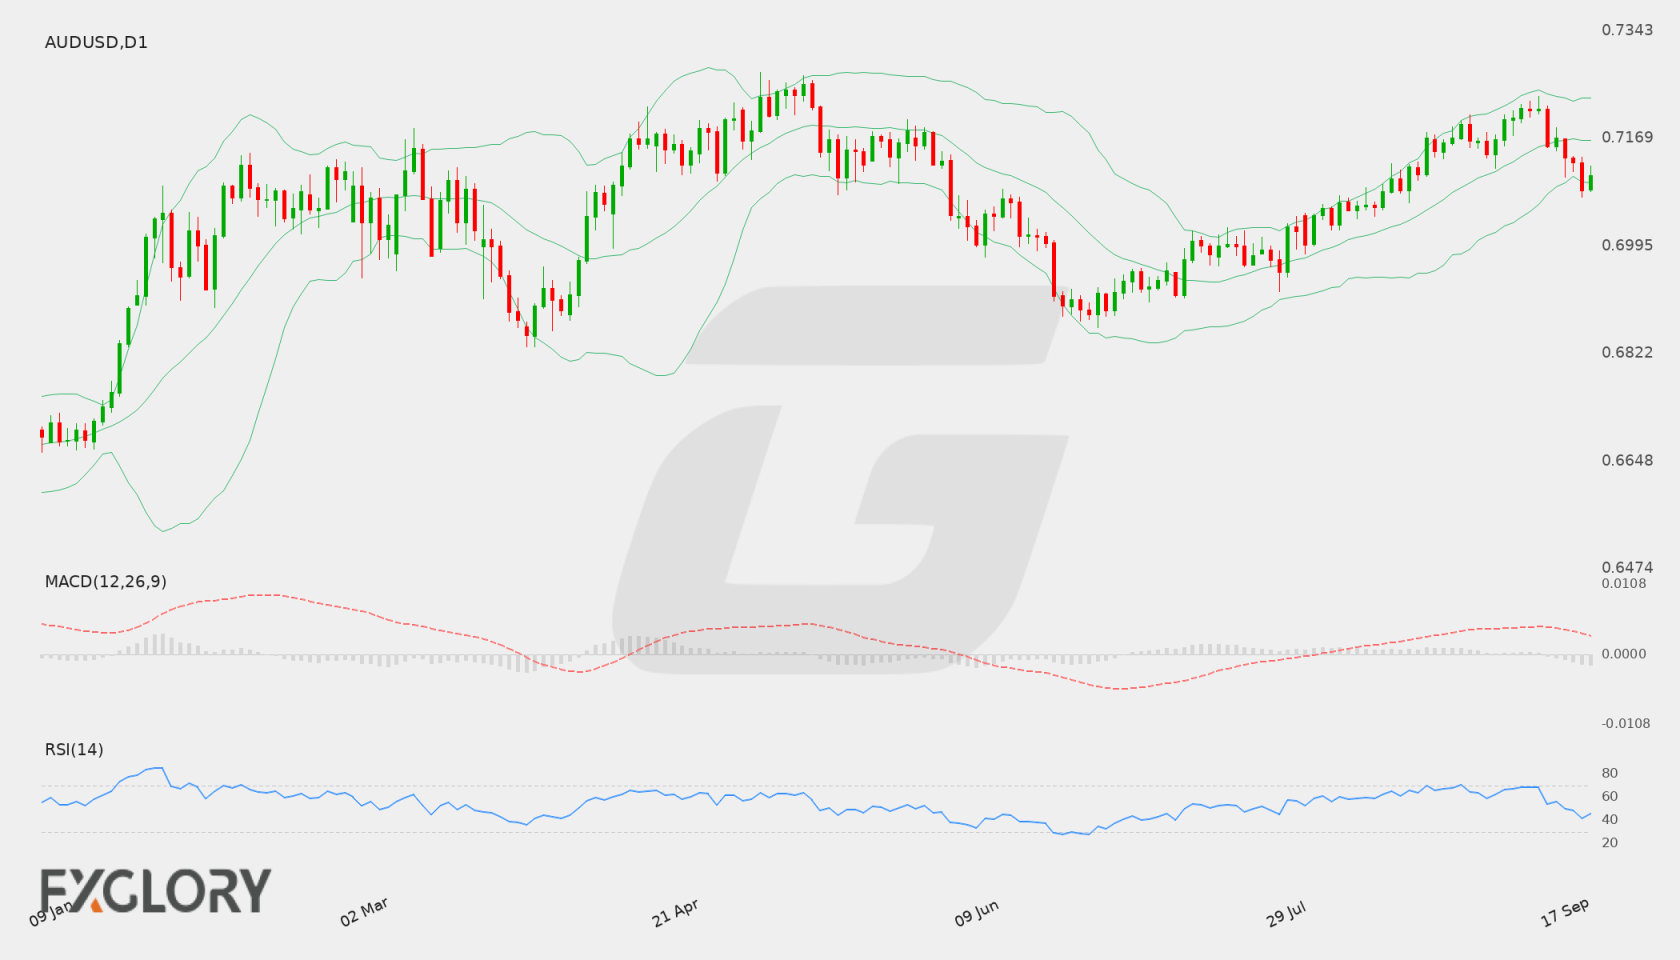
On the daily (D1) chart, AUD/USD recently experienced a retreat from the 0.7216 area toward 0.7086 before closing at 0.71088. Recent daily candles show short-term selling pressure after the pair was unable to sustain momentum above the 0.7200 handle.
Key Technical Indicators:
Bollinger Bands: The Daily Bollinger Bands feature a middle band at 0.71660, an upper band at 0.72342, and a lower band at 0.70978. Trading at 0.71088, AUD/USD is positioned near the lower band, reflecting recent downside momentum below the 20-day moving average.
RSI: The 14-day RSI stands at 45.61, placing AUD/USD in a neutral zone below the 50 level. This suggests modest bearish momentum without signaling oversold conditions.
MACD: The daily MACD indicator registers a value of 0.00112. Although remaining slightly above the zero line, the reading shows diminishing bullish momentum following the recent pullback from recent highs.
Support and Resistance:
Key daily technical levels reveal primary support at 0.68639 and upper resistance at 0.72364. Additionally, the lower Bollinger band around 0.70978 provides immediate technical structure.
News to Watch for AUDUSD This Week:
- Cash Rate: This decision directly impacts borrowing costs and yields for the Australian dollar.
- RBA Rate Statement: Provides insights into monetary policy outlook and economic evaluation from the central bank.
- RBA Press Conference: Offers clarification on recent rate decisions and future policy trajectories.
- CB Consumer Confidence: Reflects US consumer sentiment which can influence consumer spending and dollar valuation.
- JOLTS Job Openings: Indicates labor market demand and economic strength in the United States.
- CPI y/y: Measures annual inflation pressure in Australia affecting interest rate expectations.
- Trimmed Mean CPI m/m: Tracks core inflation trends by excluding extreme price shifts.
- CPI m/m: Signals monthly changes in consumer goods and services prices.
- ADP Non-Farm Employment Change: Estimates private sector payroll additions prior to official employment data.
- Core PCE Price Index m/m: Serves as a key inflation metric tracked by the Federal Reserve.
- Final GDP q/q: Reflects the overall economic growth rate for the United States.
- ISM Manufacturing PMI: Assesses activity levels within the US manufacturing sector.
- Average Hourly Earnings m/m: Tracks wage growth trends which influence inflationary pressure.
- Non-Farm Employment Change: Evaluates job creation outside the farming sector as a major indicator of US labor health.
- Unemployment Rate: Highlights the percentage of the US workforce that is unemployed.
Weekly Outlook and Consideration:
AUD/USD enters the week trading near 0.71088, positioned below its daily middle Bollinger band of 0.71660 and close to the lower band at 0.70978. With an RSI of 45.61 and a MACD of 0.00112, technical indicators align with a neutral-to-soft tone. A sustained move above 0.71660 could encourage a retest of resistance at 0.72364, while continued pressure below the middle band keeps focus on support at 0.68639. Upcoming economic releases from both economies are likely to drive near-term directional bias.
Disclaimer: The analysis provided for AUD/USD is for informational purposes only and does not constitute investment advice. Traders are encouraged to perform their own analysis and research before making any trading decisions. Market conditions can change quickly, so staying informed with the latest data is essential.