Time Zone: GMT +3
Time Frame: Daily (D1) / Weekly Outlook
Weekly Fundamental Overview:
Fundamental sentiment for GBP/USD remains heavily influenced by economic trends in both the UK and the US. Market participants continue to track broad economic performance, central bank policy expectations, and overall risk appetite to determine the pair’s trajectory.
Price Action:
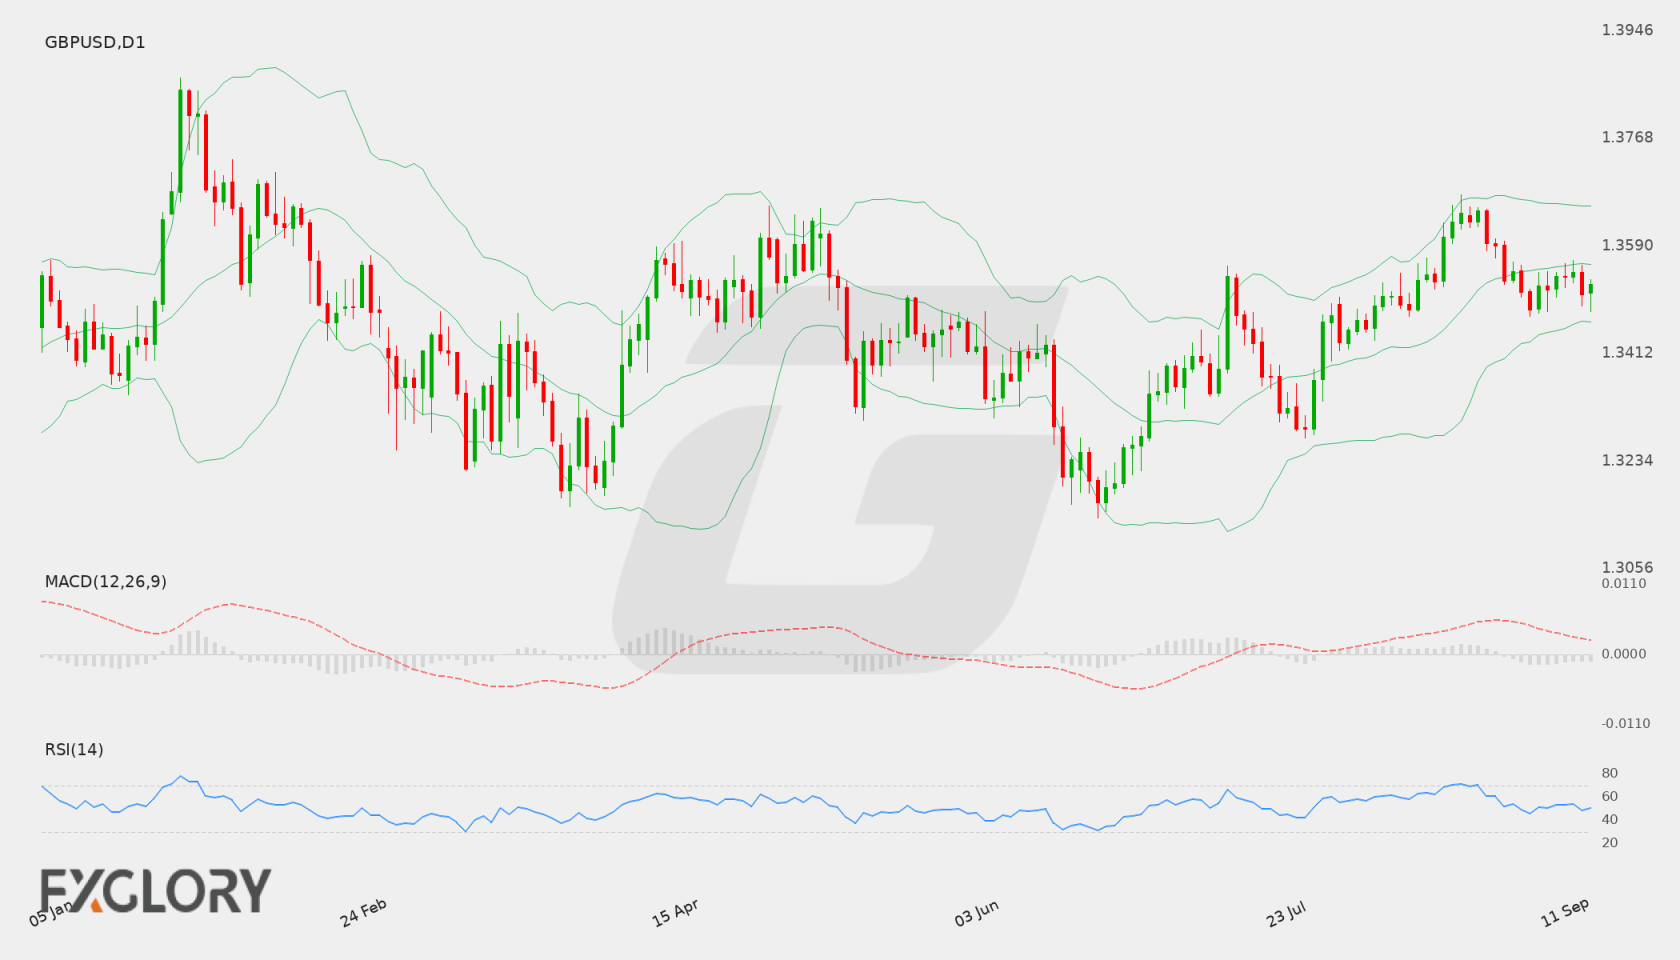
On the daily (D1) chart, GBP/USD closed at 1.35254. Recent price movement reflects a range-bound environment, oscillating between the resistance level near 1.36742 and key support around 1.31392.
Key Technical Indicators:
Bollinger Bands: The Bollinger Bands indicator on the daily chart places the middle band at 1.35597, the upper band at 1.36556, and the lower band at 1.34638. Trading at 1.35254, GBP/USD is fluctuating near the middle band, signaling neutral market volatility.
RSI: The 14-period Relative Strength Index (RSI) stands at 50.58. This neutral reading suggests a balance between buying and selling pressures, keeping the market away from overbought or oversold extremes.
MACD: The MACD indicator shows a value of 0.00111. Sitting slightly above zero, it indicates weak bullish momentum without strong directional conviction.
Support and Resistance:
Technical analysis indicates critical daily resistance at 1.36742 and key daily support at 1.31392. Immediate boundary lines are further marked by the upper Bollinger Band at 1.36556 and lower band at 1.34638.
News to Watch for GBPUSD This Week:
- Flash Services PMI: Measures activity in the UK services sector, which can significantly influence sentiment toward the British pound.
- Flash Manufacturing PMI: Offers snapshot data on UK industrial activity, giving investors clues about overall economic health.
- Unemployment Claims: Reflects weekly US jobless claims, providing insight into US labor market strength and potential dollar movements.
Weekly Outlook and Consideration:
GBP/USD presents a largely neutral outlook for the coming week. With the price near the middle Bollinger Band of 1.35597 and RSI close to 50.58, trading may remain consolidated within the broader technical channel defined by support at 1.31392 and resistance at 1.36742 until a clearer catalyst emerges.
Disclaimer: The analysis provided for GBP/USD is for informational purposes only and does not constitute investment advice. Traders are encouraged to perform their own analysis and research before making any trading decisions. Market conditions can change quickly, so staying informed with the latest data is essential.