Time Zone: GMT +3
Time Frame: Daily (D1) / Weekly Outlook
Weekly Fundamental Overview:
Australian labor conditions and upcoming US economic sentiment indicators are positioned to drive near-term sentiment for AUD/USD. Traded developments around regional employment and US consumer metrics could shape market direction over the coming sessions.
Price Action:
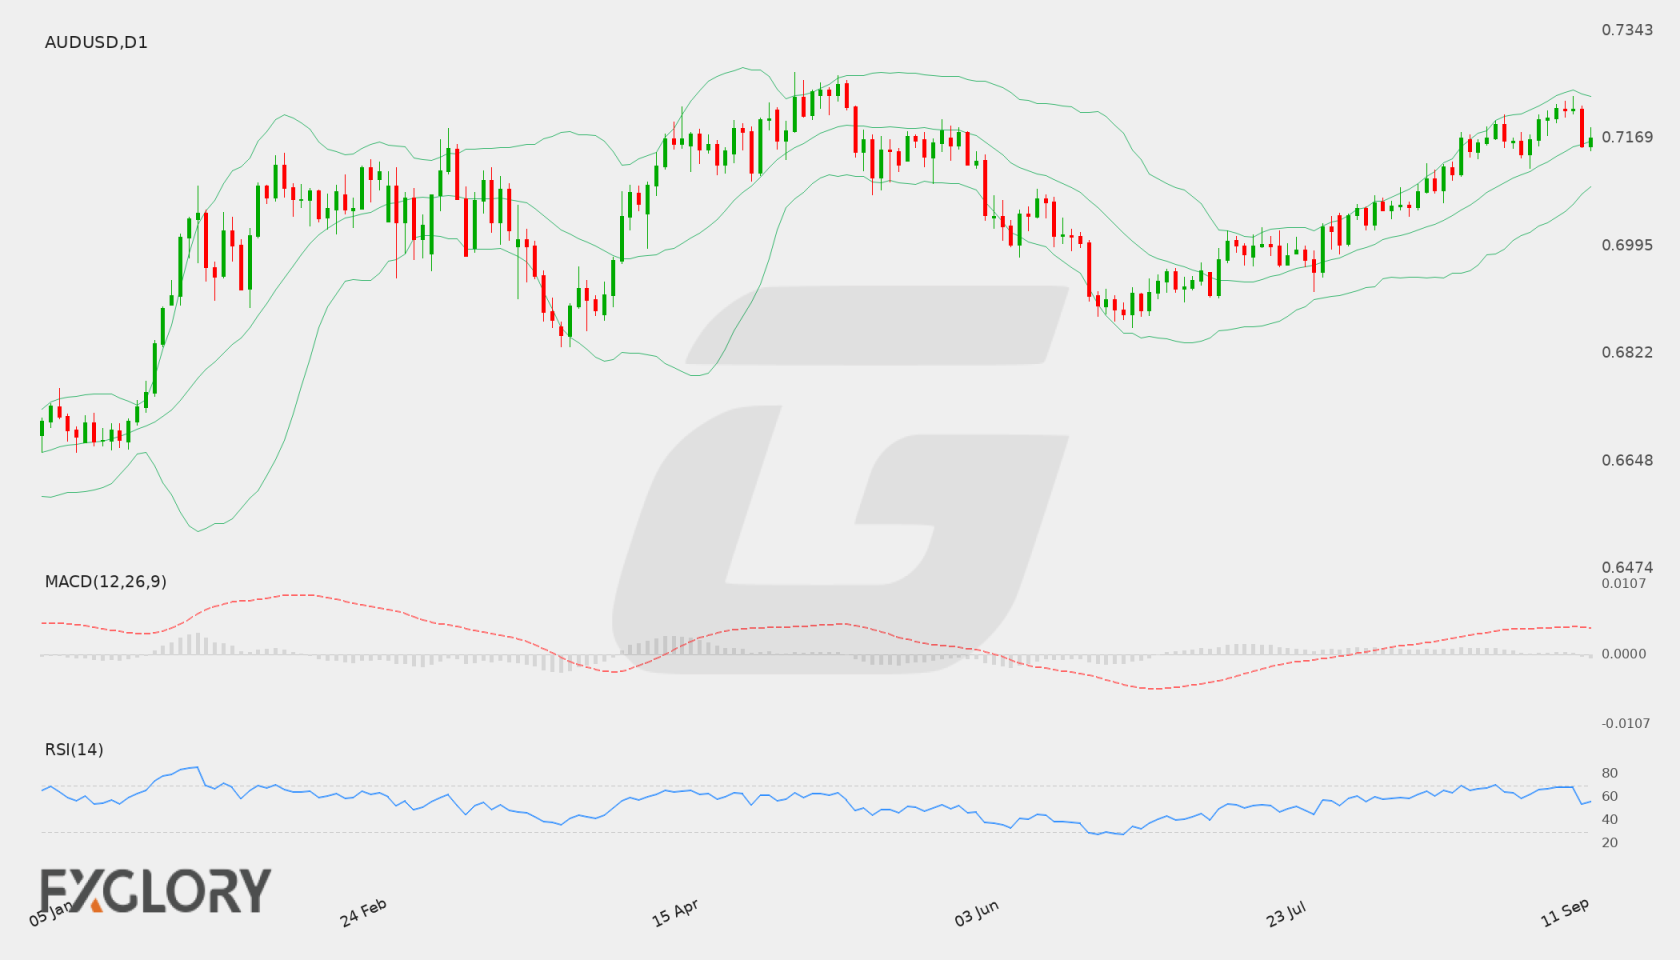
On the D1 chart, AUD/USD recently settled at 0.71696 following a slight pullback from daily highs near 0.72364. Price action continues to consolidate near recent daily averages, reflecting a balance between buyers and sellers after recent upward movement.
Key Technical Indicators:
Bollinger Bands: The D1 Bollinger Bands show AUD/USD trading close to the middle band at 0.71640. The upper band is situated at 0.72370, while the lower band lies at 0.70911, reflecting a defined channel of recent price volatility.
RSI: The 14-day RSI stands at 55.91, placing AUD/USD in neutral territory with a subtle bullish lean, remaining well below overbought thresholds.
MACD: The MACD line is currently reading 0.003505, maintaining a position above the zero mark. This indicates that mild underlying bullish momentum remains present on the daily chart.
Support and Resistance:
Key D1 technical parameters for AUD/USD highlight a immediate resistance level at 0.72364 and primary support situated lower at 0.68639.
News to Watch for AUDUSD This Week:
- Employment Change: This Australian labor market metric provides insight into job creation and economic momentum.
- Unemployment Rate: Shifts in Australia's jobless rate can influence monetary policy expectations.
- Unemployment Claims: Weekly US labor market data helps gauge underlying employment conditions.
- Revised UoM Inflation Expectations: Finalized consumer inflation sentiment reflects potential price pressures.
- Revised UoM Consumer Sentiment: Updated consumer confidence metrics indicate the health of US household spending.
Weekly Outlook and Consideration:
AUD/USD maintains a stable D1 profile near 0.71696, supported by an RSI of 55.91 and a positive MACD indicator. If buying pressure resumes, the currency pair may test the upper boundary near the 0.72364 resistance level. Conversely, should selling pressure increase, price action could drift lower toward the primary support at 0.68639. Traders will monitor incoming high-impact economic data for directional cues.
Disclaimer: The analysis provided for AUD/USD is for informational purposes only and does not constitute investment advice. Traders are encouraged to perform their own analysis and research before making any trading decisions. Market conditions can change quickly, so staying informed with the latest data is essential.