Time Zone: GMT +3
Time Frame: Daily (D1) / Weekly Outlook
Weekly Fundamental Overview:
The fundamental backdrop for NZD/CAD is influenced by shifting economic conditions in New Zealand and Canada. Foreign exchange traders are closely evaluating relative interest rate expectations, commodity price fluctuations, and key macroeconomic releases from both nations. Incoming Canadian inflation data alongside New Zealand growth figures are expected to drive market sentiment across the pair.
Price Action:
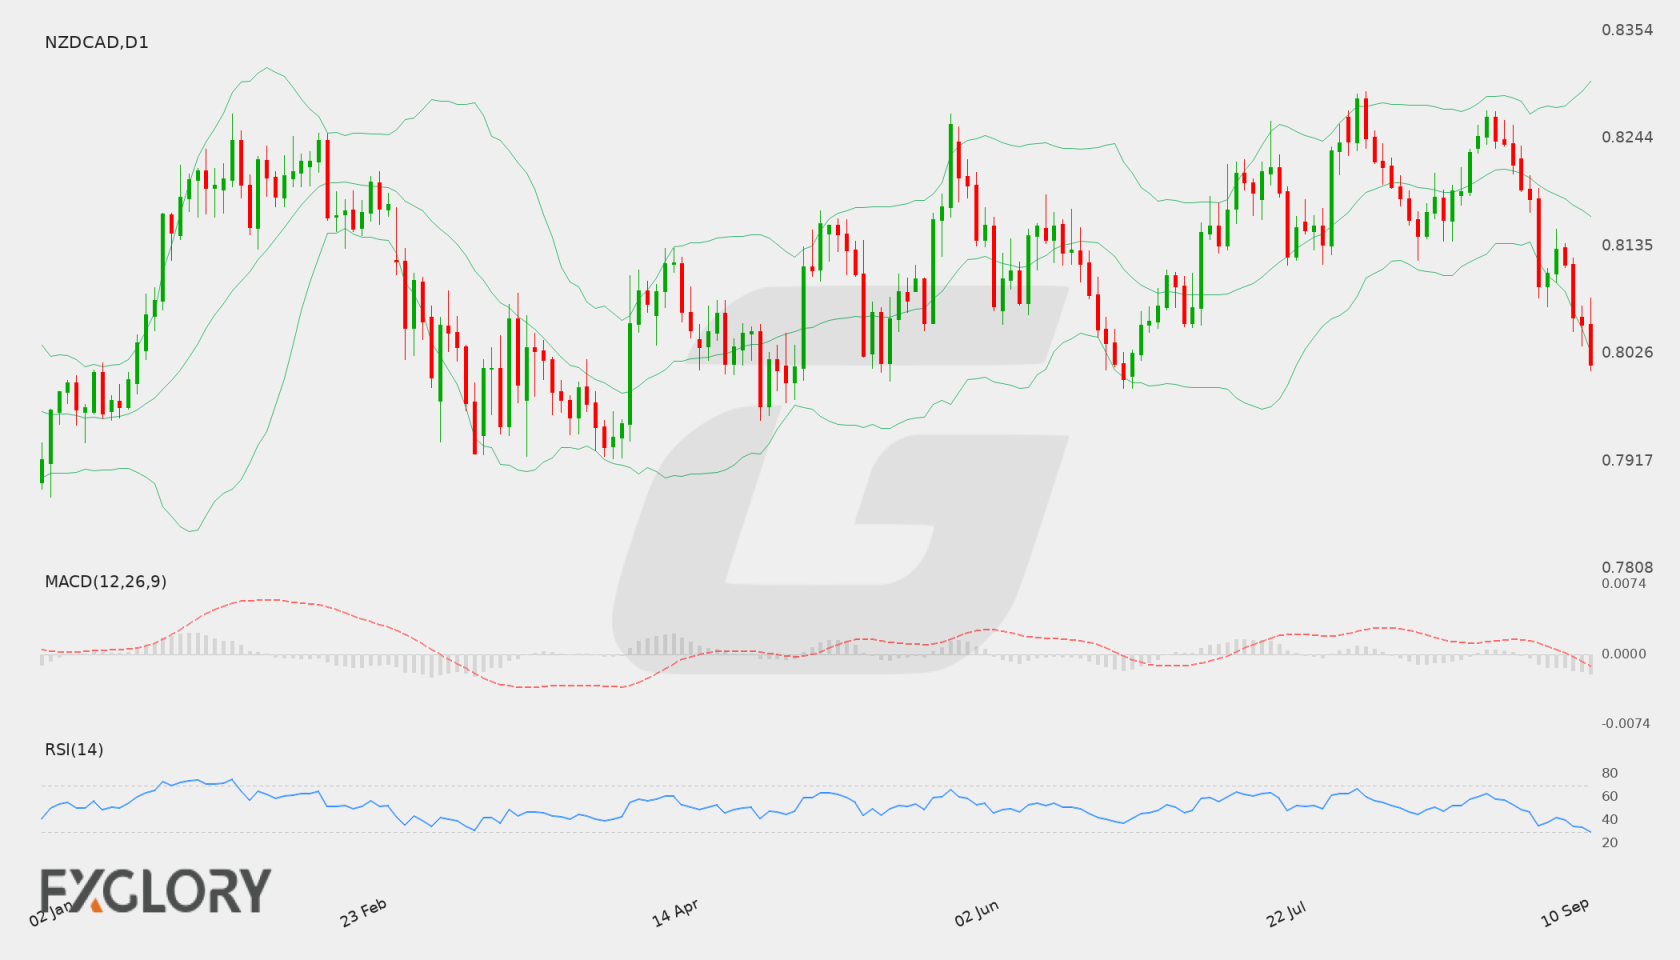
On the Daily (D1) timeframe, NZD/CAD has experienced sustained downward price action, dropping from recent highs above 0.8260 down to a last close of 0.80154. The series of lower daily closes illustrates established selling pressure, bringing the pair closer to major technical floors.
Key Technical Indicators:
Bollinger Bands: The daily Bollinger Bands exhibit a middle line at 0.81651, an upper band at 0.83028, and a lower band at 0.80274. NZD/CAD closed at 0.80154, trading below the lower Bollinger Band. This location outside the lower envelope underscores heightened downside volatility and strong selling momentum.
RSI: The 14-period Relative Strength Index (RSI) stands at 29.88, dipping into oversold territory below the 30 mark. While an oversold RSI confirms aggressive selling pressure, it also raises the possibility of potential short-term consolidation or corrective relief.
MACD: The MACD indicator registers a value of -0.00337, holding below the zero line. This negative reading signals that bearish momentum continues to dominate on the daily chart, reinforcing the current downtrend.
Support and Resistance:
Key technical support for NZD/CAD is located at 0.79904, serving as a critical level for buyers to defend. On the upside, primary technical resistance is positioned at 0.82919, which aligns near the upper Bollinger Band.
News to Watch for NZDCAD This Week:
- Trimmed CPI y/y: This key inflation measure influences Canadian monetary policy expectations and currency volatility.
- Median CPI y/y: Tracking median price changes provides deeper insight into underlying Canadian inflation trends.
- CPI m/m: Monthly consumer price readings highlight short-term inflationary momentum in Canada.
- Common CPI y/y: Broad core inflation data helps traders assess broader economic conditions in Canada.
- GDP q/q: Quarterly economic growth figures offer vital guidance on the health of the New Zealand economy.
Weekly Outlook and Consideration:
NZD/CAD maintains a bearish daily outlook as price action rests at 0.80154, beneath the lower Bollinger Band of 0.80274. Negative MACD values at -0.00337 confirm prevailing downside momentum, though an RSI of 29.88 signals oversold conditions. A sustained break beneath key support at 0.79904 could extend the downtrend, whereas a rebound from current levels may push price back toward the 0.81651 middle Bollinger Band and resistance at 0.82919. Upcoming Canadian CPI releases and New Zealand GDP data will likely act as key catalysts.
Disclaimer: The analysis provided for NZD/CAD is for informational purposes only and does not constitute investment advice. Traders are encouraged to perform their own analysis and research before making any trading decisions. Market conditions can change quickly, so staying informed with the latest data is essential.