Time Zone: GMT +3
Time Frame: Daily (D1) / Weekly Outlook
Weekly Fundamental Overview:
The USD/ZAR currency pair remains largely influenced by broad US dollar sentiment and overall risk appetite across emerging markets. Upcoming economic announcements from the United States, particularly regarding employment and manufacturing sectors, are poised to impact trader expectations and drive short-term price movements in USD/ZAR.
Price Action:
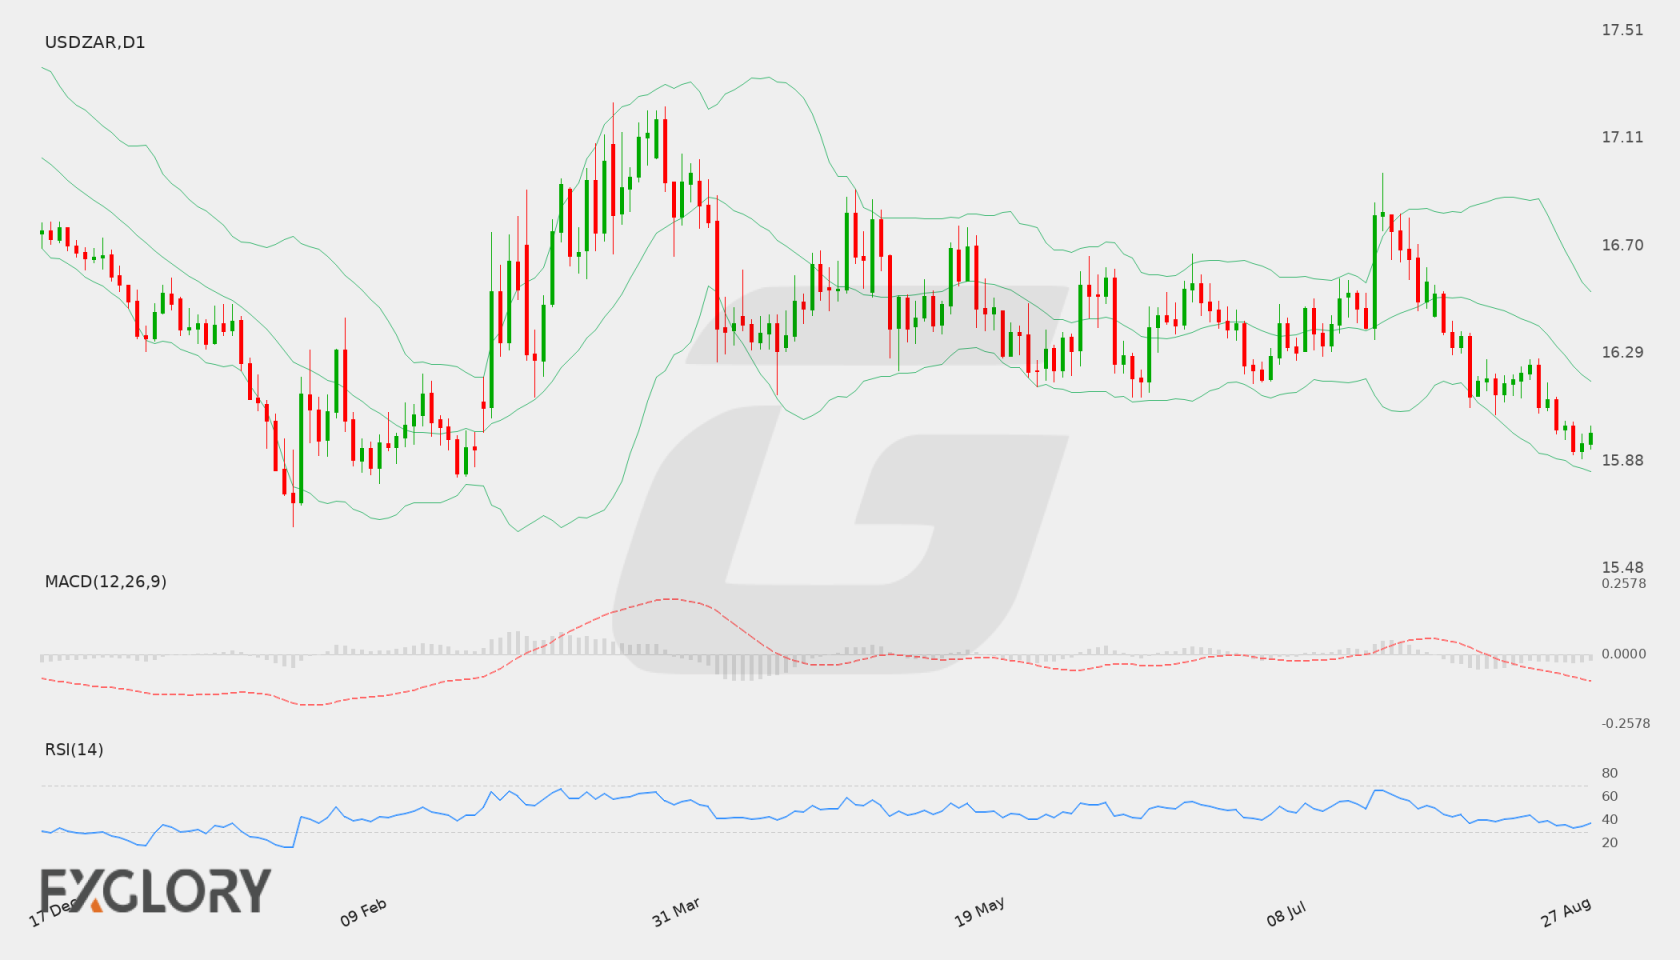
On the Daily (D1) chart, USD/ZAR has experienced sustained selling pressure, with the price trending downward to close at 15.98954. Recent daily candles demonstrate a pattern of lower highs and lower lows, pressing the price near recent local support levels.
Key Technical Indicators:
Bollinger Bands: The Bollinger Bands display a downward tilt as USD/ZAR trades near the lower band at 15.84433. The middle band (20-period moving average) sits at 16.18481, acting as dynamic overhead resistance, while the upper band is located at 16.52530.
RSI: The 14-day Relative Strength Index (RSI) stands at 37.41. This reading indicates bearish momentum without entering oversold territory below 30, suggesting sellers currently retain market control.
MACD: The MACD indicator reinforces the prevailing bearish momentum, registering a value of -0.12090. Positioned below the zero line, the technical oscillator shows that downside momentum continues to guide the pair on the daily timeframe.
Support and Resistance:
Key technical levels for USD/ZAR include a primary support level at 15.89213, backed by the lower Bollinger Band at 15.84433. To the upside, main resistance is established at 16.97254, with intermediate resistance near the middle Bollinger Band at 16.18481.
News to Watch for USDZAR This Week:
- ISM Manufacturing PMI: Measures manufacturing economic activity which can influence broader US dollar valuation.
- JOLTS Job Openings: Indicates total job openings and labor demand trends across the economy.
- ISM Manufacturing Prices: Tracks price inflation experienced by manufacturers during production processes.
- ADP Non-Farm Employment Change: Provides an early indicator of private sector employment performance.
- ISM Services PMI: Evaluates growth conditions within the services sector to gauge economic momentum.
- Non-Farm Employment Change: Measures overall monthly job creation and reflects labor market health.
- Unemployment Rate: Details the percentage of unemployed individuals actively seeking work.
- Average Hourly Earnings m/m: Assesses wage growth trends which directly influence consumer inflation.
Weekly Outlook and Consideration:
The D1 outlook for USD/ZAR reflects a firm bearish trend supported by an RSI of 37.41 and a negative MACD value of -0.12090. If the current downward pressure persists, the pair may test key support at 15.89213. Conversely, if buyers regain footing, a corrective move toward the middle Bollinger Band around 16.18481 could materialize, with broader resistance capped near 16.97254. Market participants will watch incoming economic releases for directional clarity.
Disclaimer: The analysis provided for USD/ZAR is for informational purposes only and does not constitute investment advice. Traders are encouraged to perform their own analysis and research before making any trading decisions. Market conditions can change quickly, so staying informed with the latest data is essential.