Time Zone: GMT +3
Time Frame: Daily (D1) / Weekly Outlook
Weekly Fundamental Overview:
USD/NOK price action remains sensitive to broader shifts in US economic fundamentals and market sentiment. Incoming macroeconomic reports from the United States, including major labor market statistics and purchasing managers’ index releases, may generate volatility for the US Dollar, directly impacting the pair’s D1 trend.
Price Action:
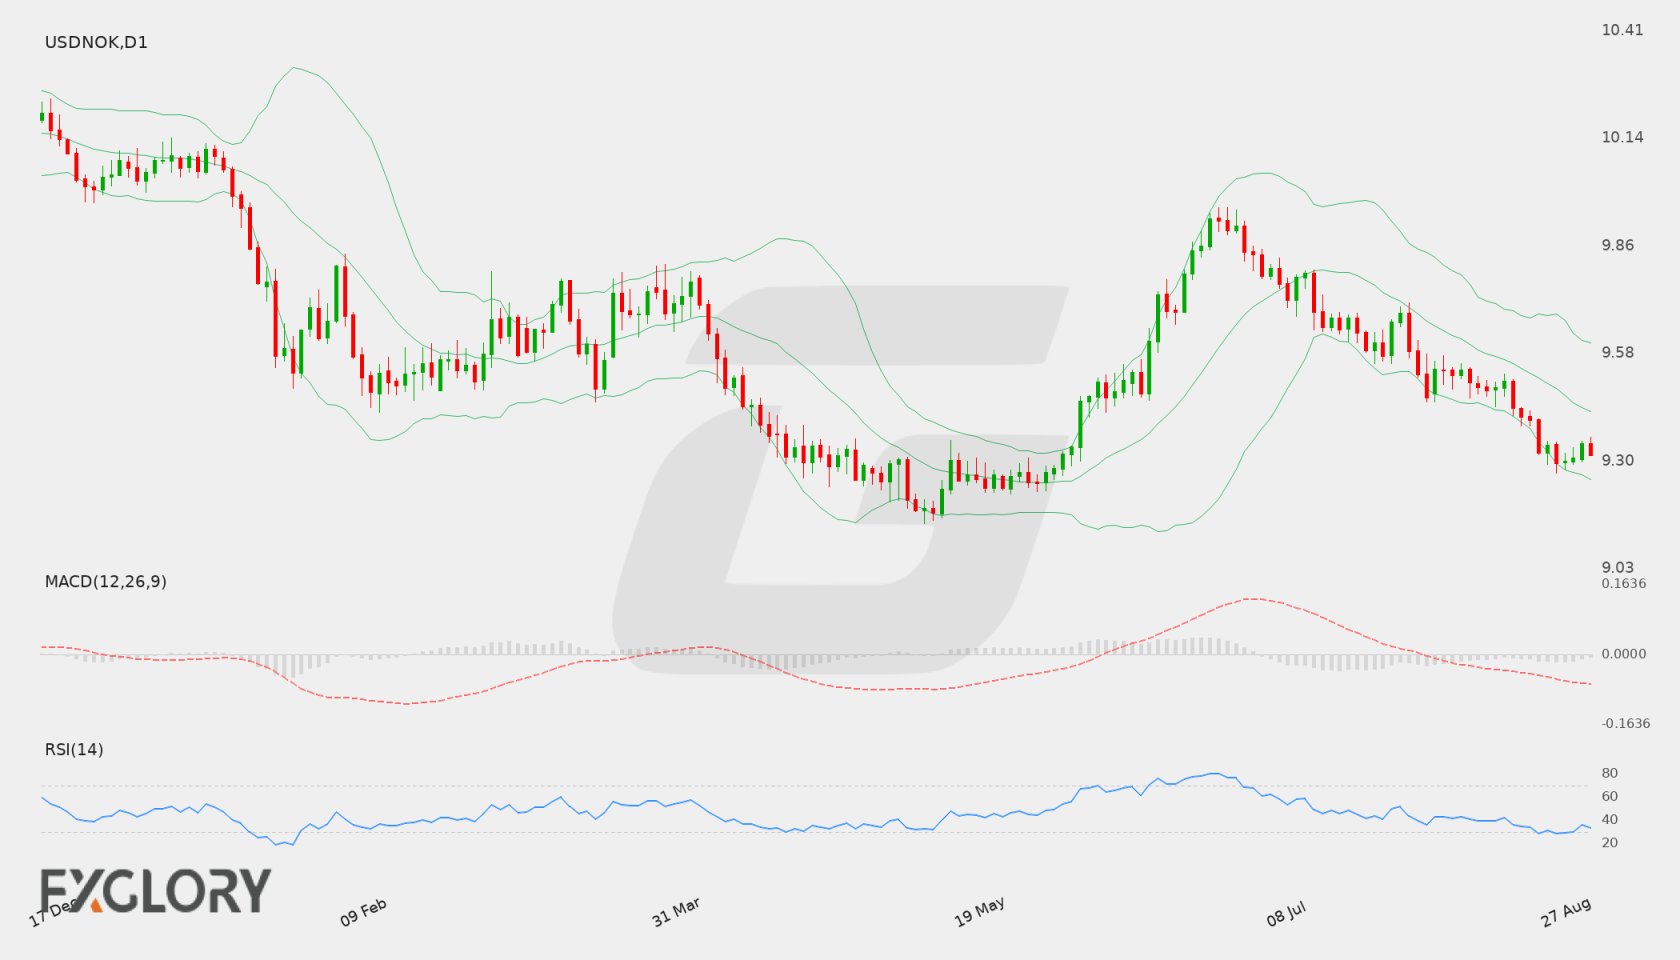
On the daily (D1) chart, USD/NOK recently closed at 9.31903 following a sustained multi-session decline from levels above 9.50000. Price action reflects consistent downside pressure, with the market continuing to trade near recent session lows.
Key Technical Indicators:
Bollinger Bands: The Bollinger Bands on the D1 timeframe show a middle band at 9.43084, an upper band at 9.60730, and a lower band at 9.25438. USD/NOK is currently trading below the middle band and moving toward the lower boundary, signaling ongoing bearish inclination.
RSI: The 14-period Relative Strength Index (RSI) is currently at 33.45. This value highlights soft buying momentum and places the indicator near the oversold region on the D1 timeframe.
MACD: The daily MACD indicator records a reading of -0.07817, remaining below the zero line. This negative value indicates that bearish momentum continues to dominate on the daily chart.
Support and Resistance:
Key technical levels for USD/NOK identify immediate support at 9.27156 and overhead resistance at 9.95824. A sustained break below 9.27156 could trigger additional downside exploration, while any recovery attempt will encounter strong resistance near 9.95824.
News to Watch for USDNOK This Week:
- ISM Manufacturing PMI: This index measures business activity in the US manufacturing sector and can influence sentiment surrounding the US Dollar.
- JOLTS Job Openings: This data highlights labor market demand and provides insight into overall US employment trends.
- ISM Manufacturing Prices: This metric reflects price pressures within the manufacturing sector and can impact inflation expectations.
- ADP Non-Farm Employment Change: This report provides an early estimate of private-sector job growth in the US.
- ISM Services PMI: This survey assesses economic health in the service sector, potentially affecting US Dollar dynamics.
- Non-Farm Employment Change: This key employment release measures job creation in the US economy and often drives sharp currency volatility.
- Unemployment Rate: This figure indicates the percentage of the labor force that is unemployed, serving as a vital gauge of economic momentum.
- Average Hourly Earnings m/m: This release measures wage growth and offers signals regarding underlying consumer inflation.
Weekly Outlook and Consideration:
The technical outlook for USD/NOK on the D1 chart leans bearish, as reflected by an RSI of 33.45 and a negative MACD value of -0.07817. With price holding at 9.31903 below the middle Bollinger Band at 9.43084 and near support at 9.27156, market participants will be monitoring incoming economic events for direction. A breakdown past support could confirm further downside momentum, whereas a rise above the middle band would be required to diminish immediate sell-side pressure.
Disclaimer: The analysis provided for USD/NOK is for informational purposes only and does not constitute investment advice. Traders are encouraged to perform their own analysis and research before making any trading decisions. Market conditions can change quickly, so staying informed with the latest data is essential.