Time Zone: GMT +3
Time Frame: Daily (D1) / Weekly Outlook
Weekly Fundamental Overview:
The USD/DKK currency pair has recently experienced downward pressure as market participants weigh economic conditions in the United States against European macroeconomic trends. Upcoming US economic releases, particularly around manufacturing and labor conditions, are expected to play a critical role in shaping market expectations regarding interest rate trajectory and dollar demand for the USDDKK pair.
Price Action:
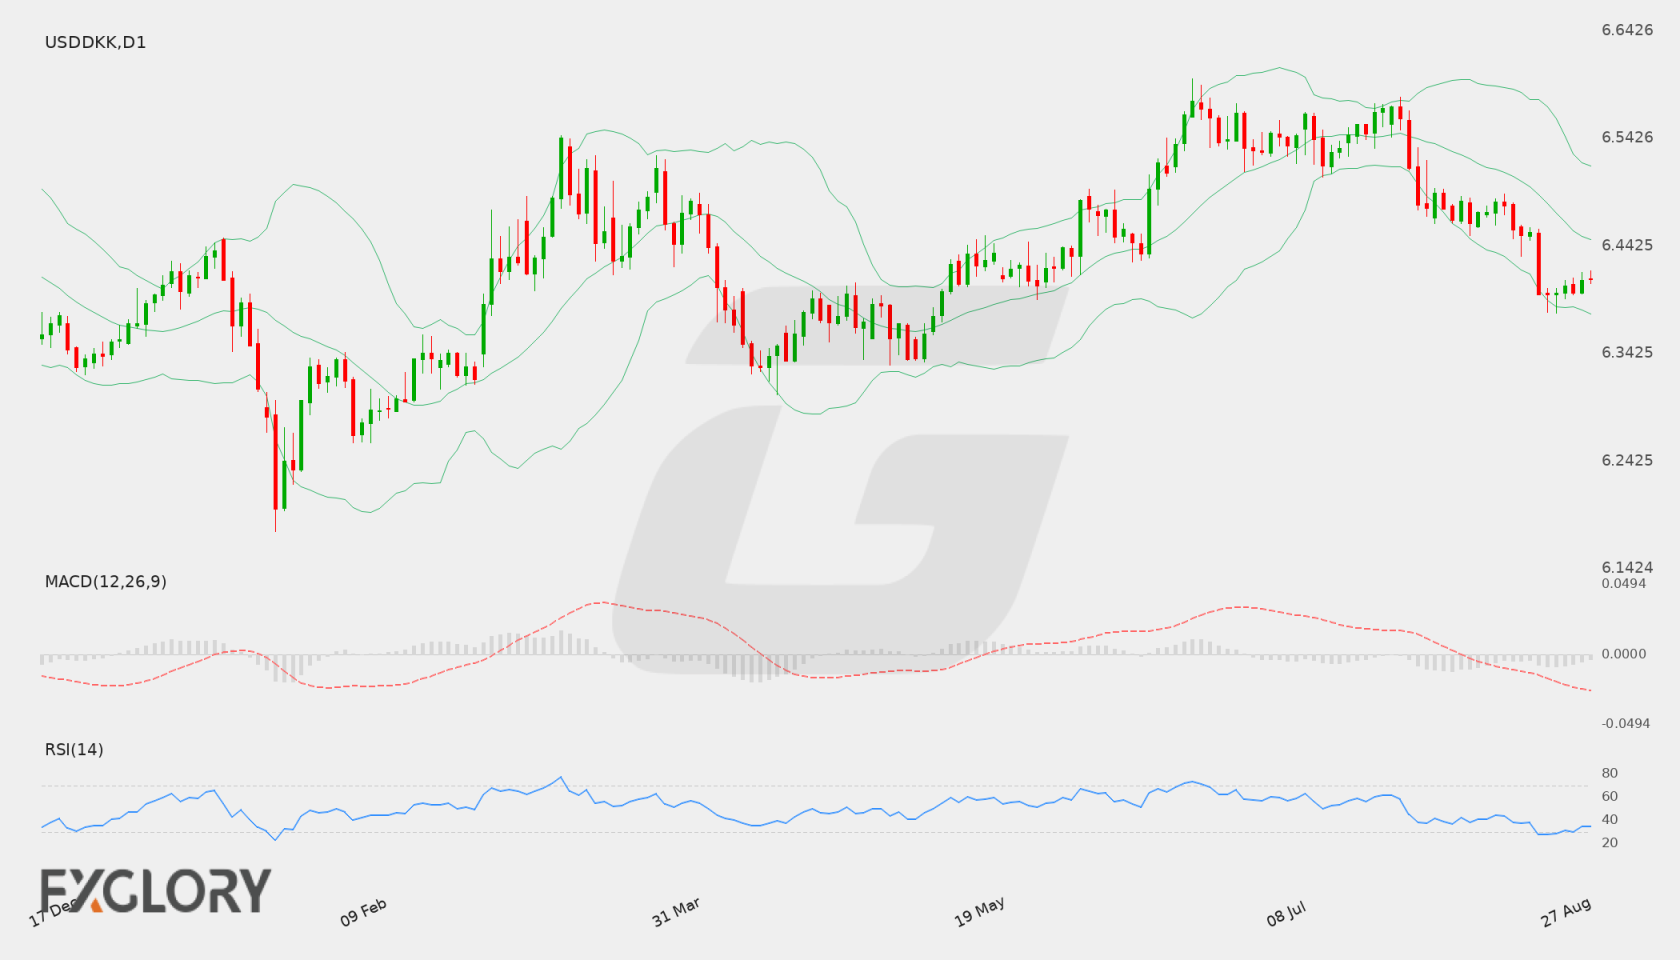
On the daily D1 chart, USD/DKK closed its latest trading session at 6.41154. Following a sustained decline from multi-week highs, price action has shown signs of stabilization near recent swing lows around 6.39700. The currency pair is attempting a minor bounce, though overall price structures remain constrained below key moving averages.
Key Technical Indicators:
Bollinger Bands: The Bollinger Bands indicator on the daily chart shows a middle band at 6.44801, an upper band at 6.51704, and a lower band at 6.37897. USD/DKK is currently trading near the lower boundary of the envelope, reflecting recent bearish momentum while remaining within the bands as volatility stabilizes.
RSI: The 14-day Relative Strength Index (RSI) is recorded at 34.70. This level positions the indicator near oversold territory, signaling significant selling pressure in recent sessions while leaving room for potential consolidation or a brief corrective move.
MACD: The MACD indicator stands at -0.02922, operating below the zero line. This negative value reflects ongoing bearish momentum over the daily period, though flattening histogram bars suggest that downside momentum may be decelerating.
Support and Resistance:
Key technical levels for USD/DKK on the daily chart include established support at 6.37991 and primary resistance at 6.59788. A break below immediate support could expose lower territory, whereas sustained gains above resistance would be required to shift the broader trend outlook.
News to Watch for USDDKK This Week:
- ISM Manufacturing PMI: Assesses activity in the US manufacturing sector, which can significantly influence USD sentiment.
- JOLTS Job Openings: Measures monthly job openings to gauge labor market tightness and overall economic health.
- ISM Manufacturing Prices: Highlights inflationary pressures within the manufacturing sector affecting monetary policy expectations.
- ADP Non-Farm Employment Change: Provides an early look at private-sector employment additions, impacting expectations for official labor reports.
- ISM Services PMI: Evaluates growth in the dominant service sector, offering insights into broader economic momentum.
- Non-Farm Employment Change: Reflects total payroll expansion, serving as a primary catalyst for USD volatility.
- Unemployment Rate: Indicates labor market capacity and overall economic strength, impacting Federal Reserve policy expectations.
- Average Hourly Earnings m/m: Tracks wage inflation trends, influencing consumer spending and monetary policy outlooks.
Weekly Outlook and Consideration:
The weekly outlook for USD/DKK remains cautious following a retreat toward the 6.39700 zone. With the pair trading near its lower Bollinger Band at 6.37897 and an RSI of 34.70, selling momentum has shown signs of slowing. However, with the MACD remaining below the zero mark at -0.02922 and price action holding below the middle band at 6.44801, buyers need to push above interim resistance to signal a genuine reversal. Market volatility will likely depend heavily on incoming economic releases.
Disclaimer: The analysis provided for USD/DKK is for informational purposes only and does not constitute investment advice. Traders are encouraged to perform their own analysis and research before making any trading decisions. Market conditions can change quickly, so staying informed with the latest data is essential.