Time Zone: GMT +3
Time Frame: Daily (D1) / Weekly Outlook
Weekly Fundamental Overview:
The GBP/AUD pair is navigating a shifting macroeconomic landscape as market participants weigh economic growth performance against monetary policy expectations. Upcoming output statistics and central bank hearings could drive refreshed sentiment for both the British Pound and Australian Dollar, making technical D1 levels particularly important for evaluating price structure.
Price Action:
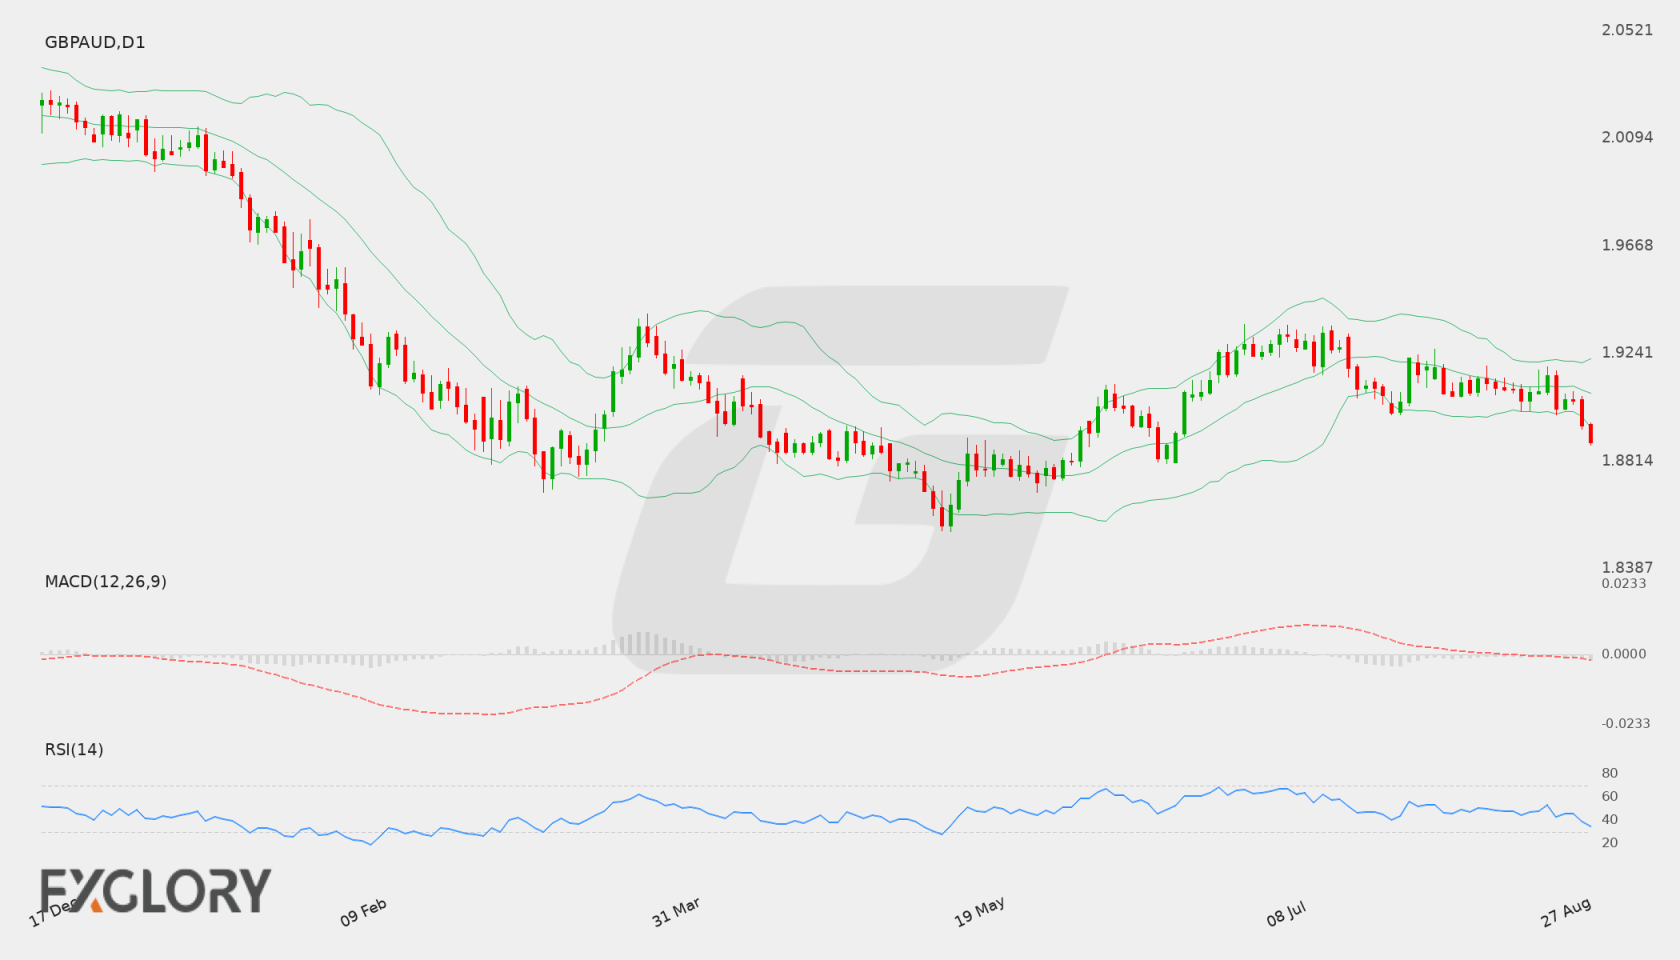
On the daily (D1) timeframe, GBP/AUD has experienced extended selling pressure, falling from recent high attempts near resistance at 1.93568 to close at 1.88893. The consecutive lower daily closes reflect dominant short-term bearish momentum heading toward key support.
Key Technical Indicators:
Bollinger Bands: The Bollinger Bands on the daily chart show the middle band at 1.90832, the upper band at 1.92193, and the lower band at 1.89472. The pair's latest close at 1.88893 sits below the lower band, signaling intense downward expansion and elevated volatility.
RSI: The 14-period Relative Strength Index (RSI) stands at 34.66. While approaching oversold territory below the 30 threshold, the indicator demonstrates sustained selling pressure without an immediate bullish reversal signal.
MACD: The D1 MACD indicator is currently reading -0.00393, remaining below its signal line in negative territory. This persistent negative histogram value underscores strong bearish momentum across daily timeframes.
Support and Resistance:
Key technical levels for GBP/AUD feature immediate support at 1.87921 and major resistance at 1.93568. Intermediate resistance also aligns near the middle Bollinger Band around 1.90832.
News to Watch for GBPAUD This Week:
- GDP q/q: Detailed quarterly growth figures offer direct insight into economic expansion and currency valuation.
- Monetary Policy Report Hearings: Central bank official testimony can influence interest rate expectations and drive market volatility.
Weekly Outlook and Consideration:
The broader technical picture for GBP/AUD shows strong bearish momentum on the D1 chart, with price closing at 1.88893 below the lower Bollinger Band of 1.89472 and RSI at 34.66. If sellers maintain control, price action may approach the primary support level near 1.87921. Conversely, any upside pullbacks will likely encounter resistance around the middle Bollinger Band at 1.90832 before targeting major resistance at 1.93568. Traders should monitor high-impact calendar updates for potential momentum shifts.
Disclaimer: The analysis provided for GBP/AUD is for informational purposes only and does not constitute investment advice. Traders are encouraged to perform their own analysis and research before making any trading decisions. Market conditions can change quickly, so staying informed with the latest data is essential.