Time Zone: GMT +3
Time Frame: Daily (D1) / Weekly Outlook
Weekly Fundamental Overview:
The AUD/JPY pair has demonstrated strong upward momentum, recently reaching a daily close of 114.635. Market focus remains on macroeconomic performance, where shifts in global risk appetite and national output metrics play a crucial role in directing capital flows between the Australian Dollar and Japanese Yen. Traders closely monitor economic data releases for signals regarding underlying currency strength.
Price Action:
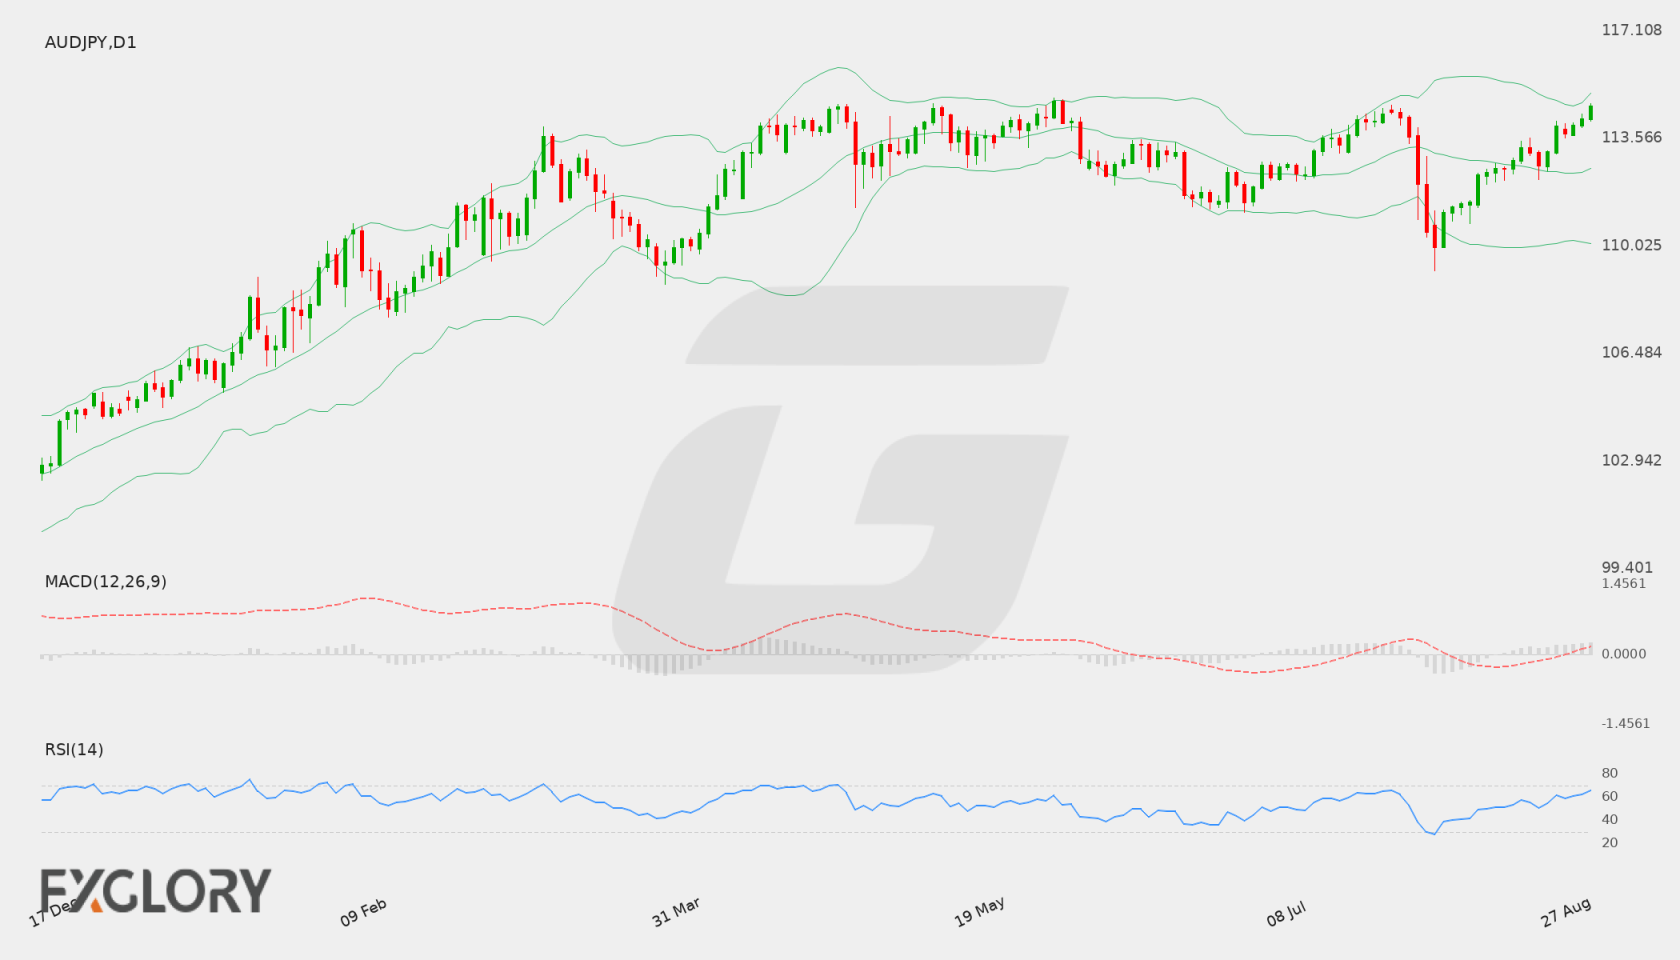
Daily price action shows a consistent upward trajectory over recent sessions, moving from a low consolidation area around 112.564 up to the current close of 114.635. The price is currently testing near the upper ceiling of its recent range, approaching key resistance at 114.708.
Key Technical Indicators:
Bollinger Bands: The Bollinger Bands on the D1 chart reflect an expanding channel with the middle band at 112.567, the upper band at 115.045, and the lower band at 110.089. Trading at 114.635, AUD/JPY is positioned near the upper band, indicating elevated buying momentum within the volatility structure.
RSI: The 14-period Relative Strength Index (RSI) stands at 65.255, reflecting firm bullish control without crossing into deeply overbought territory above 70. This provides room for continued buying pressure before reaching potential exhaustion.
MACD: The MACD indicator registers a positive value of 0.4061, confirming a bullish bias on the daily timeframe. The ongoing positive histogram readings signal sustained momentum in favor of further potential gains.
Support and Resistance:
Key technical levels for AUD/JPY include immediate resistance at 114.708 and primary support down at 109.212. Dynamic baseline support is also provided by the middle Bollinger Band near 112.567.
News to Watch for AUDJPY This Week:
- GDP q/q: Quarterly gross domestic product figures provide critical evaluation of economic performance and currency demand.
Weekly Outlook and Consideration:
The technical setup for AUD/JPY suggests a dominant bullish momentum as price action remains pressed against the high resistance zone at 114.708. Supported by a positive MACD of 0.4061 and an RSI of 65.255, a sustained push could see the pair move toward the upper Bollinger Band boundary at 115.045. Conversely, if resistance holds firm, price action may pull back to test initial dynamic support near the 112.567 region before attempting another upward push.
Disclaimer: The analysis provided for AUD/JPY is for informational purposes only and does not constitute investment advice. Traders are encouraged to perform their own analysis and research before making any trading decisions. Market conditions can change quickly, so staying informed with the latest data is essential.