Time Zone: GMT +3
Time Frame: Daily (D1) / Weekly Outlook
Weekly Fundamental Overview:
The AUD/CHF currency pair remains sensitive to economic indicators originating from Australia and Switzerland, as well as broader shifts in global risk sentiment. Traders evaluate domestic macroeconomic data releases and central bank guidance to gauge potential interest rate paths and currency demand.
Price Action:
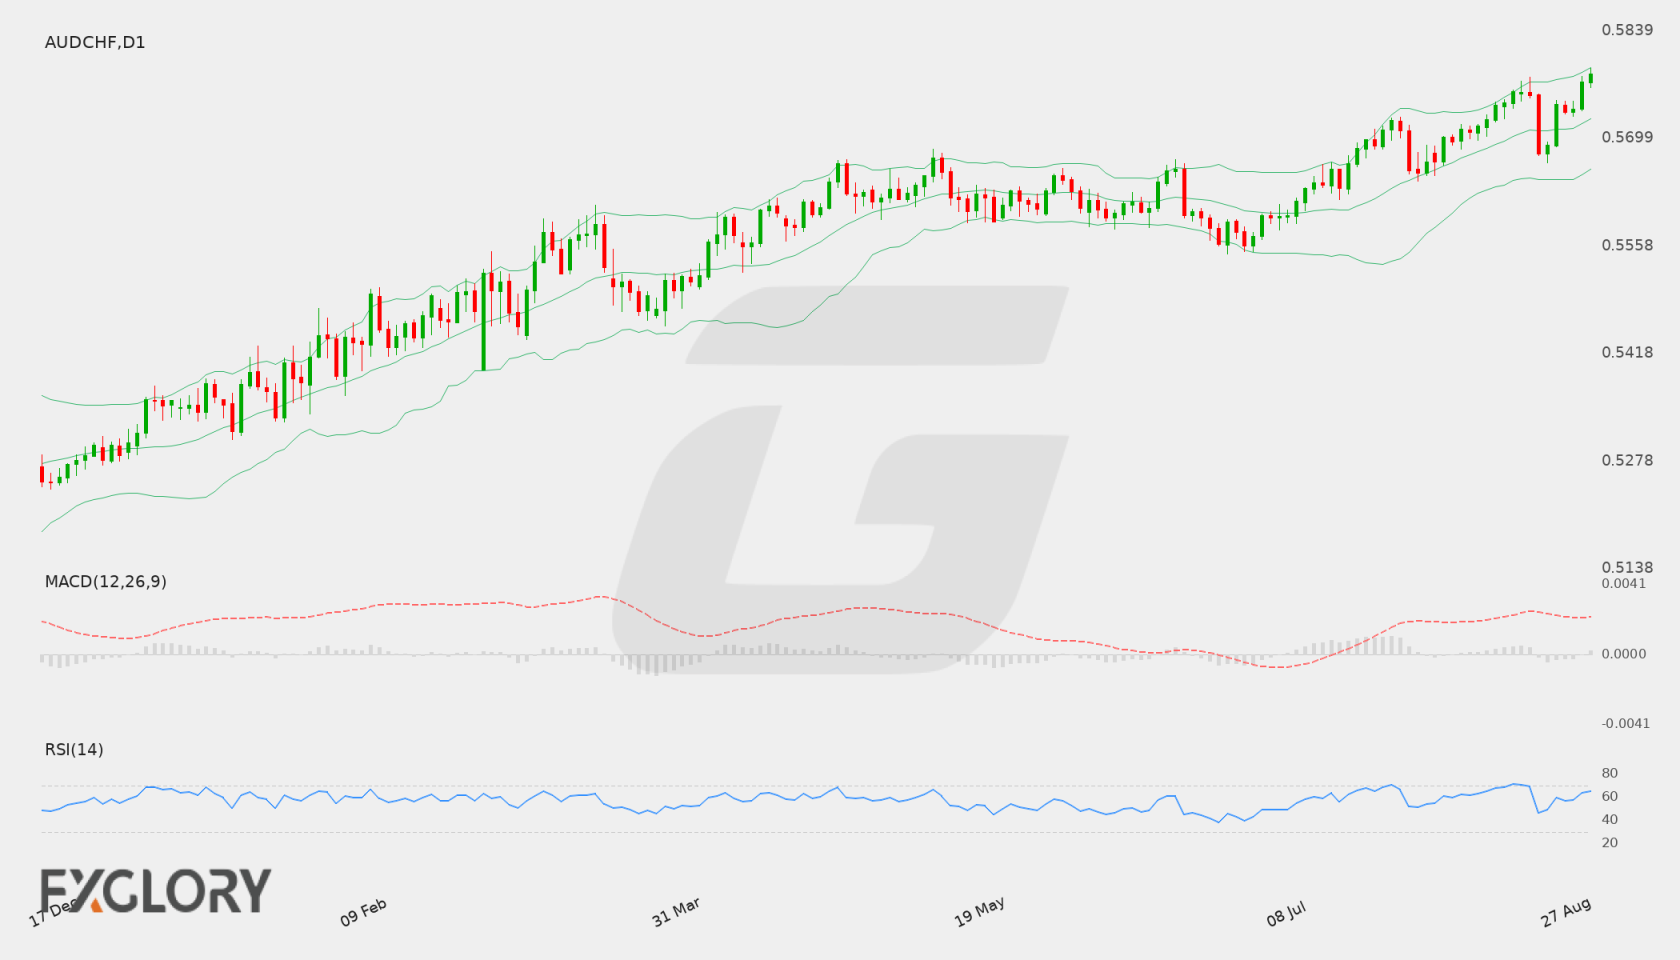
On the daily (D1) chart, AUD/CHF recently closed at 0.57831 after advancing from recent session lows. Price action has shown sustained upward movement over recent trading days, pushing the pair toward its recent high of 0.57899.
Key Technical Indicators:
Bollinger Bands: The daily Bollinger Bands indicate that AUD/CHF is trading near the upper band located at 0.57906. The middle band (20-period moving average) sits at 0.57243, while the lower band is situated at 0.56579, positioning price action in the upper portion of the volatility band.
RSI: The 14-period Relative Strength Index (RSI) on the daily timeframe registers at 65.03. This reading indicates firm bullish momentum while remaining below the typical overbought threshold of 70.
MACD: The D1 MACD indicator reflects positive momentum with a value of 0.002405. The indicator remains above its zero baseline, pointing to prevailing bullish momentum in recent sessions.
Support and Resistance:
Key technical levels on the daily chart identify immediate resistance at 0.57899. On the downside, primary technical support is situated at 0.55481, with the middle Bollinger Band at 0.57243 acting as potential dynamic support.
News to Watch for AUDCHF This Week:
- GDP q/q: Quarterly economic growth figures can influence central bank interest rate expectations and drive national currency demand.
- CPI m/m: Monthly consumer inflation figures offer insights into domestic price pressures and monetary policy direction.
Weekly Outlook and Consideration:
The AUD/CHF pair maintains a firm bullish stance on the D1 chart, closing at 0.57831 near its upper Bollinger Band of 0.57906 and key resistance at 0.57899. With the daily RSI standing at 65.03 and MACD positive at 0.002405, buyers remain in control of the near-term trend. A sustained break above 0.57899 could allow for further upward continuation. However, if buyers fail to clear this resistance, a pullback toward the middle Bollinger Band at 0.57243 or lower support levels down to 0.55481 remains possible.
Disclaimer: The analysis provided for AUD/CHF is for informational purposes only and does not constitute investment advice. Traders are encouraged to perform their own analysis and research before making any trading decisions. Market conditions can change quickly, so staying informed with the latest data is essential.