Time Zone: GMT +3
Time Frame: Daily (D1) / Weekly Outlook
Weekly Fundamental Overview:
USD/JPY trades near 159.38 as market participants prepare for key US macroeconomic data releases. Broad sentiment around USD/JPY remains sensitive to incoming labor market and manufacturing statistics, which could influence foreign exchange volatility throughout the week.
Price Action:
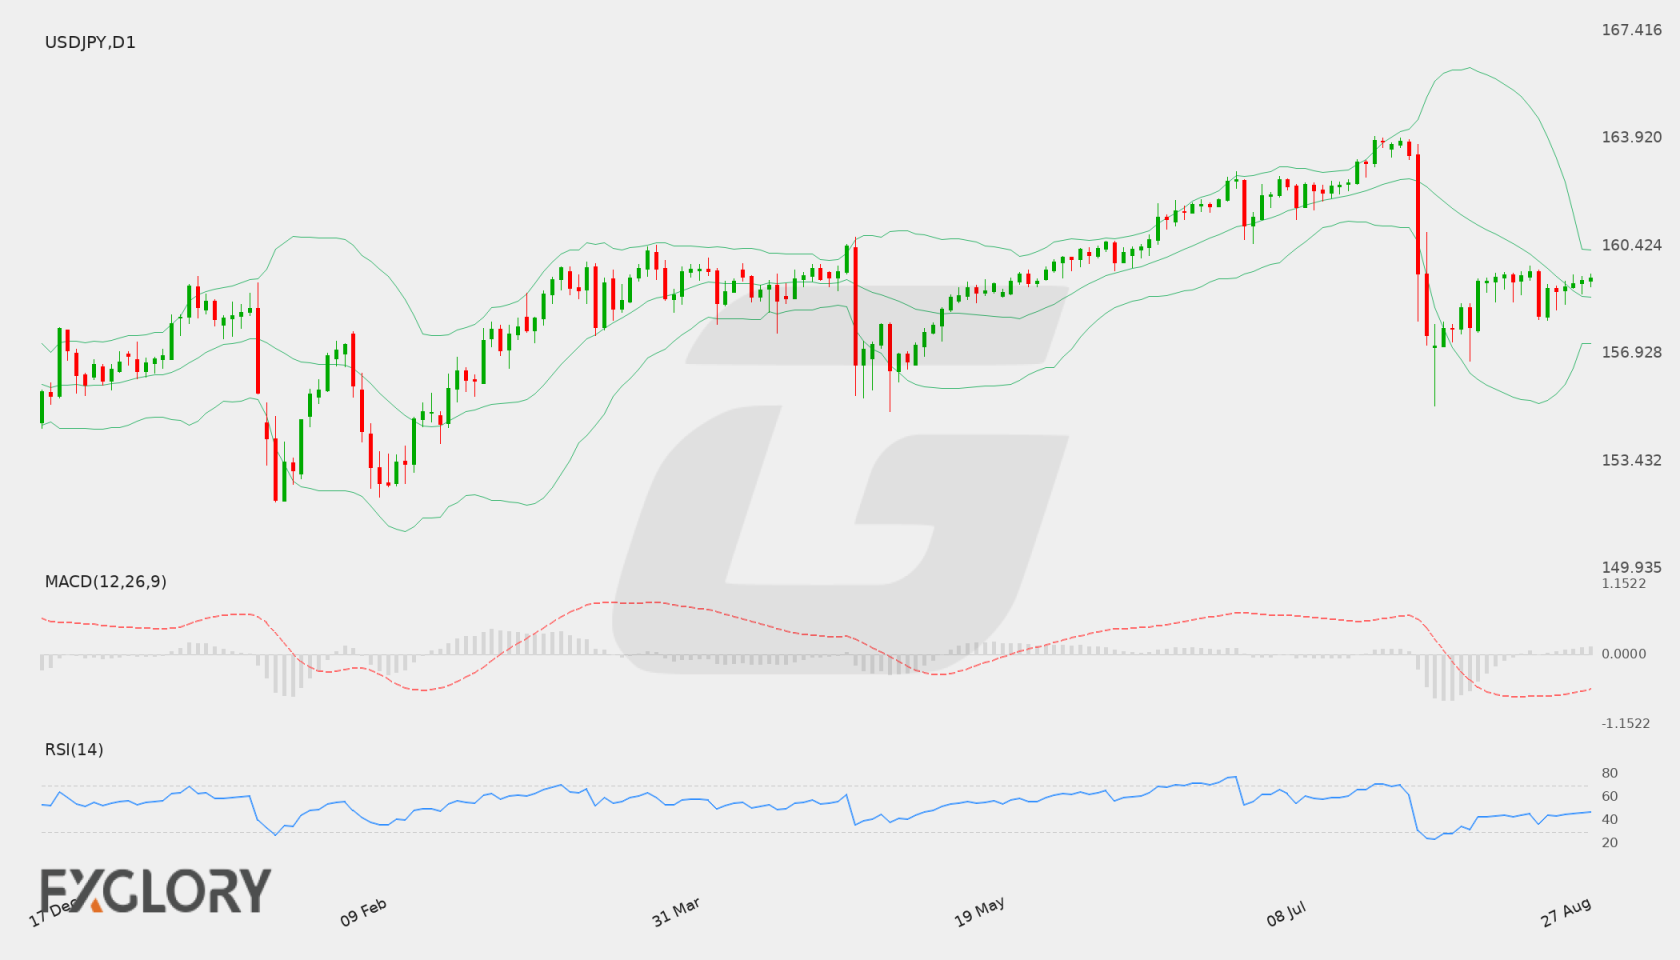
On the Daily (D1) chart, USD/JPY recently closed at 159.38 after consolidating following recent fluctuations. The price action reflects steadying behavior around the 159.00 region after bouncing off lower daily bounds.
Key Technical Indicators:
Bollinger Bands: The Bollinger Bands indicate a middle band at 158.76, an upper band at 160.28, and a lower band at 157.24. Trading at 159.38, USD/JPY is currently positioned slightly above the middle band, signaling neutral-to-slight bullish positioning within the band spectrum.
RSI: The 14-period RSI sits at 47.07, indicating momentum is currently in neutral territory just below the mid-point of 50.
MACD: The MACD indicator is registered at -0.446, reflecting modest negative momentum despite recent price stabilization near the 159.38 level.
Support and Resistance:
Key technical parameters for USD/JPY include established support at 155.214 and resistance at 163.973.
News to Watch for USDJPY This Week:
- ISM Manufacturing PMI: This indicator measures manufacturing activity and provides insight into underlying economic momentum.
- JOLTS Job Openings: A gauge of labor demand that offers perspective on US employment strength.
- ISM Manufacturing Prices: Reports on input price changes within manufacturing, offering clues on inflation developments.
- ADP Non-Farm Employment Change: Private sector payroll data provides early metrics on labor market expansion.
- ISM Services PMI: Tracks economic activity in the services sector, influencing broader dollar sentiment.
- Non-Farm Employment Change: Key employment figures that significantly shape market expectations regarding monetary policy.
- Unemployment Rate: Highlights overall labor market health and economic capacity.
- Average Hourly Earnings m/m: Measures wage growth trends that factor directly into consumer inflation pressures.
Weekly Outlook and Consideration:
USD/JPY opens the week near 159.38, framed by daily support at 155.214 and daily resistance at 163.973. Technical indicators display mixed signals, with the RSI at 47.07 and the MACD at -0.446, while price holds above the Bollinger middle band of 158.76. Upcoming economic data could dictate whether USD/JPY pushes higher toward 163.973 or pulls back toward lower support levels.
Disclaimer: The analysis provided for USD/JPY is for informational purposes only and does not constitute investment advice. Traders are encouraged to perform their own analysis and research before making any trading decisions. Market conditions can change quickly, so staying informed with the latest data is essential.