Time Zone: GMT +3
Time Frame: Daily (D1) / Weekly Outlook
Weekly Fundamental Overview:
The AUD/USD pair continues to draw influence from domestic Australian economic output alongside key United States macro indicators. Incoming data including Australian GDP figures and major US labor market statistics are poised to drive sentiment and price volatility for both currency components.
Price Action:
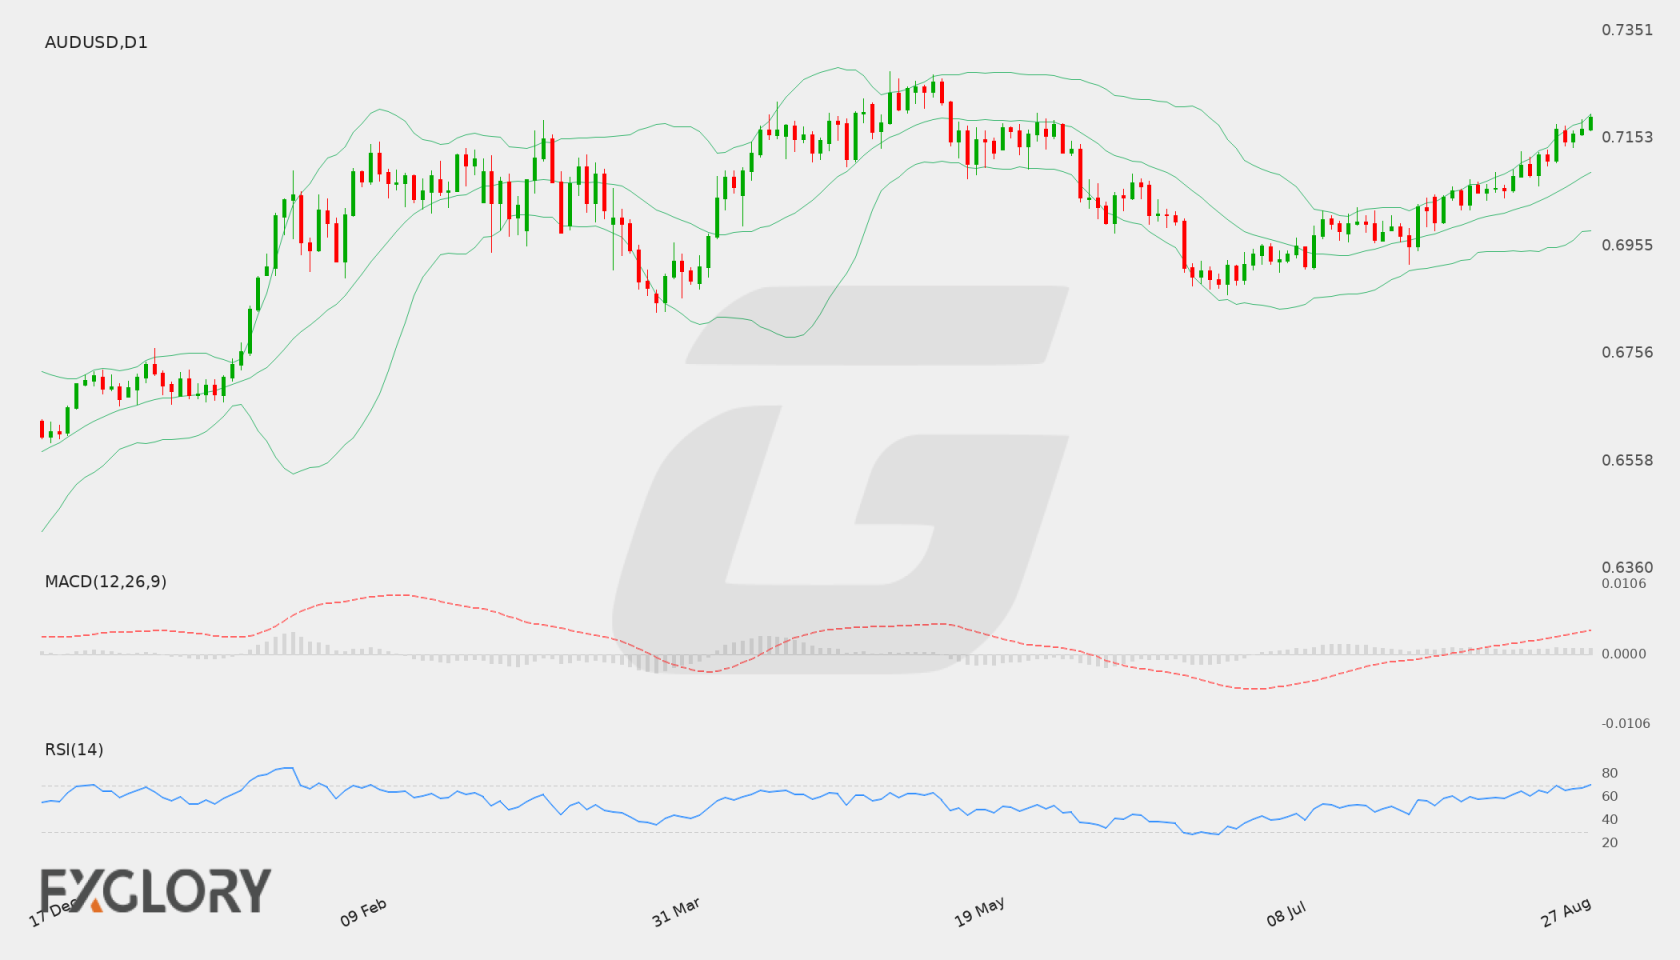
On the daily timeframe, AUD/USD demonstrates a persistent upward trend, moving higher from levels around 0.6950 toward the 0.7190 region. Price action reflects sustained bullish momentum over recent sessions, holding near the upper end of its recent trading range.
Key Technical Indicators:
Bollinger Bands: Bollinger Bands analysis highlights elevated bullish momentum, with AUD/USD trading at 0.71921, near the upper band at 0.71976. The middle moving average sits at 0.70898, while the lower band rests at 0.69820, pointing to an expanded channel during the ongoing advance.
RSI: The 14-day Relative Strength Index (RSI) stands at 70.16, entering overbought territory. While this reflects strong buying pressure in AUD/USD, it also highlights the potential for brief pauses or temporary consolidations.
MACD: The daily MACD indicator remains positive at 0.00449, staying aligned with the broader bullish trend. This positive reading indicates strong underlying buyer momentum, though proximity to major overhead levels warrants close observation.
Support and Resistance:
Daily chart technical levels establish clear parameters for the AUD/USD currency pair. Key resistance sits immediately overhead at 0.71963, while significant support is located further below at 0.68639.
News to Watch for AUDUSD This Week:
- ISM Manufacturing PMI: Measures activity levels in the manufacturing sector to gauge economic momentum.
- JOLTS Job Openings: Indicates the volume of open job positions across the economy.
- ISM Manufacturing Prices: Tracks price pressure within the manufacturing industry.
- GDP q/q: Evaluates quarterly Australian economic performance and growth trends.
- ADP Non-Farm Employment Change: Provides an early look into private-sector employment changes.
- ISM Services PMI: Assesses economic conditions and activity within the service sector.
- Non-Farm Employment Change: Measures overall national job creation outside the farming industry.
- Unemployment Rate: Reflects the percentage of the labor force currently seeking employment.
- Average Hourly Earnings m/m: Measures changes in worker compensation to evaluate labor cost trends.
Weekly Outlook and Consideration:
The weekly outlook for AUD/USD remains constructive based on daily technical indicators, supported by positive MACD values and strong price positioning near the 0.71976 upper Bollinger Band. However, with the RSI at 70.16 and price approaching key resistance at 0.71963, traders should watch for potential short-term pullbacks or consolidation. Upcoming economic releases, particularly Australian GDP and US Non-Farm Employment data, could define whether AUD/USD maintains its current trend or tests lower support zones.
Disclaimer: The analysis provided for AUD/USD is for informational purposes only and does not constitute investment advice. Traders are encouraged to perform their own analysis and research before making any trading decisions. Market conditions can change quickly, so staying informed with the latest data is essential.